Download
1 / 12
130 likes | 351 Views
Measurement and Uncertainties. Topic 7. 1 Graphical Analysis. Logarithmic Functions. For example A = A o e - t This can be transformed to give In A = In A o - t This is now in the form y =mx + c Where m = - And c = In A o This can then be plotted as a semi-log graph.

E N D
Measurement and Uncertainties Topic 7.1 Graphical Analysis
Logarithmic Functions • For example A = Aoe-t • This can be transformed to give In A = In Ao - t • This is now in the form y =mx + c • Where m = - • And c = In Ao • This can then be plotted as a semi-log graph
Example 2 • y = kxn • This can be transformed to give In y = In k+ n Inx • This is now in the form y =mx + c • Where m = n • And c = In k • This can then be plotted as a log-log graph
The parameters of the original equation can also be obtained from the slope (m) and the intercept (c) of a straight line graph
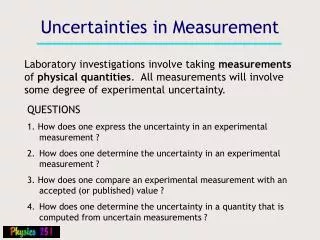
Absolute, Fractional and Percentage Uncertainties • Absolute uncertainties are in the same units as the value • i.e. 5.6 ± 0.05 cm • Fractional and percentage uncertainties are this absolute value expressed as a fraction or percentage of the value • 0.05/5.6 = 0.009 • 5.6cm ± 0.9%
Addition & Subtraction • When adding measurements • add the absolute errors • When subtracting measurements • Add the absolute errors • When multiplying or dividing measurements, and powers • Add the relative or percentage errors of the measurements being multiplied or divided • then change back to an absolute error
Examples • What is the product of 2.6 0.5 cm and 2.8 0.5cm ? • First we determine the product of 2.6 x 2.8 = 7.28 cm2 • Then we find the relative errors • i.e. 0.5/2.6 x 100% = 19.2% • and 0.5/2.8 x 100% = 17.9%
continued • Sum of the relative errors • 19.2% + 17.9% = 37.1% • Change to absolute error • 37.1/100 x 7.28 = 2.70cm • Therefore the product is equal to • 7.3 2.7cm2
For other functions, (such as Trigonometrical functions) the mean, the highest and lowest possible answers can be calculated to obtain the uncertainty range
If one uncertainty is much larger than others, the approximate uncertainty in the calculated answer can be taken as due to that quantity alone
Uncertainties in Graphs • To determine the uncertainties in the slope and intercepts of a straight-line graph you need to draw lines of minimum and maximum fit to the data points, plus error bars