Download
1 / 63
660 likes | 885 Views
Physical Hydrology & Hydroclimatology ( Multiscale Hydrology). A science dealing with the properties, distribution and circulation of water. R. Balaji balajir@colorado.edu CVEN5333 http://civil.colorado.edu/~balajir/CVEN5333. Additional Topics. Watershed Characteristics (Geomorphology)

E N D
Physical Hydrology & Hydroclimatology(Multiscale Hydrology) A science dealing with the properties, distribution and circulation of water. R. Balaji balajir@colorado.edu CVEN5333 http://civil.colorado.edu/~balajir/CVEN5333
Additional Topics • Watershed Characteristics (Geomorphology) • Stream network • Channel/drainage delineation • Horton Laws (scaling/power law) • Hydrograph • Hyetograph • Watershed response to events • Unit Hydrograph • Floods • Estimation at a single location • Regional – using scaling laws • Ocean Circulation • Basics • Wind driven • Impacts on Climate Physical Hydrology, Dingman (Chapter 9) Hydrology, Bras (Chapter 9 Hydrographs) & (Chapter 12 – Geomorphology) Chow (Chapter 7) http://www.cmar.csiro.au/currents/animations.htm http://mysciencespace.com/Oceans/print.htm http://hydrology.usu.edu/taudem/taudem5.0/index.html
Watershed and Stream Network Delineation – Geomorphological Considerations David G. Tarboton dtarb@cc.usu.edu http://www.engineering.usu.edu/dtarb http://hydrology.usu.edu/taudem/taudem5.0/index.html
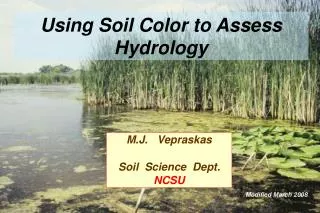
Elevation Surface — the ground surface elevation at each point Digital Elevation Model — A digital representation of an elevation surface. Examples include a (square) digital elevation grid, triangular irregular network, set of digital line graph contours or random points.
Digital Elevation Grid — a grid of cells (square or rectangular) in some coordinate system having land surface elevation as the value stored in each cell. Square Digital Elevation Grid — a common special case of the digital elevation grid
67 56 49 52 48 37 58 55 22 Direction of Steepest Descent 30 30 67 56 49 52 48 37 58 55 22 Slope:
32 64 128 16 1 8 4 2 Eight Direction Pour Point Model ESRI Direction encoding
4 3 2 5 1 6 7 8 Eight Direction Pour Point Model D8 Band/GRASS/TARDEM Direction encoding
Contributing Area Grid 1 1 1 1 1 1 1 1 1 1 1 4 3 3 1 4 3 1 1 3 1 1 1 1 1 12 1 2 1 12 1 1 1 2 16 1 1 2 1 16 2 1 3 6 25 3 6 1 2 25 TauDEM convention includes the area of the grid cell itself.
4 3 2 5 1 6 7 8 Direction encoding 1 2 3 1 1 7 6 5 2 1 7 6 5 3 6 7 7 Contributing area Programming the calculation of contributing area 2 2 3 6
1 1 1 1 1 1 4 3 3 1 1 2 1 1 12 1 1 1 2 16 2 1 3 6 25 Contributing Area > 10 Cell Threshold
100 grid cell constant support area threshold stream delineation
200 grid cell constant support area based stream delineation
AREA 2 3 AREA 1 12 How to decide on support area threshold ? Why is it important?
Hydrologic processes are different on hillslopes and in channels. It is important to recognize this and account for this in models. Drainage area can be concentrated or dispersed (specific catchment area) representing concentrated or dispersed flow.
Delineation of Channel Networks and Subwatersheds 500 cell theshold 1000 cell theshold
Examples of differently textured topography Badlands in Death Valley.from Easterbrook, 1993, p 140. Coos Bay, Oregon Coast Range. from W. E. Dietrich
Canyon Creek, Trinity Alps, Northern California. Photo D K Hagans
Gently Sloping Convex Landscape From W. E. Dietrich
Same scale, 20 m contour interval Driftwood, PA Sunland, CA Topographic Texture and Drainage Density
“landscape dissection into distinct valleys is limited by a threshold of channelization that sets a finite scale to the landscape.” (Montgomery and Dietrich, 1992, Science, vol. 255 p. 826.) Lets look at some geomorphology. • Drainage Density • Horton’s Laws • Slope – Area scaling • Stream Drops Suggestion:One contributing area threshold does not fit all watersheds.
Drainage Density • Dd = L/A • Hillslope length 1/2Dd B B Hillslope length = B A = 2B L Dd = L/A = 1/2B B= 1/2Dd L
Drainage Density for Different Support Area Thresholds EPA Reach Files 100 grid cell threshold 1000 grid cell threshold
Hortons Laws: Strahler system for stream ordering 1 3 1 2 1 2 1 1 1 1 1 2 2 1 1 1 1 1 1
Bifurcation Ratio Rb ~ 3-5
Area Ratio Ra ~ 3-6
Length Ratio Rl ~ 1.5 – 3.5
Slope-Area scaling Data from Reynolds Creek 30 m DEM, 50 grid cell threshold, points, individual links, big dots, bins of size 100