Download
1 / 16
160 likes | 291 Views
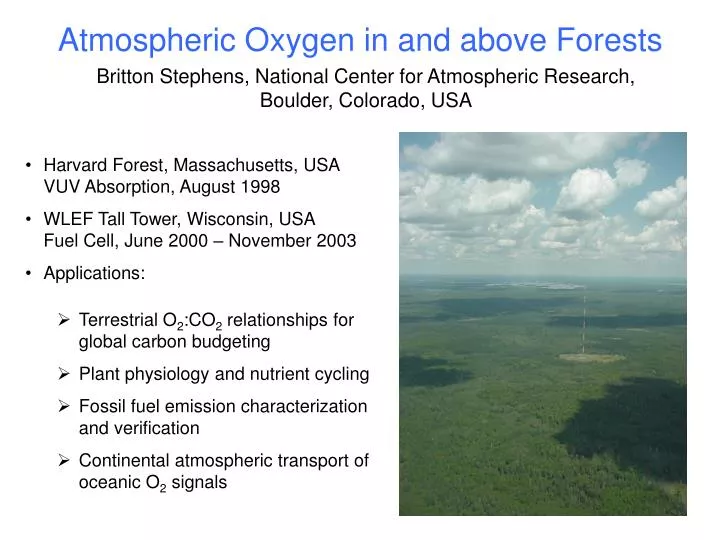
Atmospheric Oxygen in and above Forests. Harvard Forest, Massachusetts, USA VUV Absorption, August 1998 WLEF Tall Tower, Wisconsin, USA Fuel Cell, June 2000 – November 2003 Applications: Terrestrial O 2 :CO 2 relationships for global carbon budgeting

E N D
Atmospheric Oxygen in and above Forests • Harvard Forest, Massachusetts, USA VUV Absorption, August 1998 • WLEF Tall Tower, Wisconsin, USA Fuel Cell, June 2000 – November 2003 • Applications: • Terrestrial O2:CO2 relationships for global carbon budgeting • Plant physiology and nutrient cycling • Fossil fuel emission characterization and verification • Continental atmospheric transport of oceanic O2 signals Britton Stephens, National Center for Atmospheric Research, Boulder, Colorado, USA
Fuel-Cell Oxygen Analyzer Sable Systems, NV (S/N OX0001‑02) • Off the shelf: 25 per meg rms in 1 sec and ~100 per meg hourly drift • Modifications: • removed plastic tubing and filters • removed heat exchanger • common outlet plumbing • cryogenic drying • active pressure and flow control • multiple inlets and reference gases • 1-minute switching cycle • inlet pick-off tees • Resulting Precision: • 2.5 per meg rms on D in 2 minutes • 1.5 per meg rms on a 6 minute measurement every 20 minutes • 2.5 per meg drift over 6 hours
Previous results: -1.2 from a soil incubation study [J. Severinghaus] -1.05 from a wood composition survey [R. Keeling]
United States of America Oxidative Ratios for CO2 Sources Coal -1.17 ± 0.03 Liquid Fuel -1.44 ± 0.03 Expected ratio = -1.44 mol O2:mol CO2 Natural Gas -1.95 ± 0.04 Gas Flaring -1.98 ± 0.07 Cement Production 0.0 [R. Keeling, 1995] People’s Republic of China Mexico Expected ratio = -1.13 mol O2:mol CO2 Expected ratio = -1.46 mol O2:mol CO2 O2 in urban pollution studies and emission verification [from Marland, Boden, and Andres, http://cdiac.esd.ornl.gov]
Average diurnal cycles for O2 (panel tops) and CO2 (panel bottoms) -200 -300 -400 per meg O2/N2 ppm CO2 400 380 360
Monthly O2:CO2 and standard errors from ODR fit July, 2001 June, 2000 January2001 Q. What do these numbers actually represent? A1. Complex combinations of local photosynthesis and respiration influences and synoptic transport of terrestrial, industrial, and oceanic signals A2. Not likely equal to aB, but potentially related to forest growth state and nutrient partitioning.
-O2:CO2 PQ = 1.05 OR = 1.15
Blue Box and Controller RAF Oxygen Analyzer (ROXAN) Vacuum Ultraviolet Absorption – 3 per meg rms on D in 6 seconds
Potential Future Directions • Fuel-cell: • Restart at WLEF with well-characterized and improved accuracy • Deploy at another terrestrial site • Deploy on a ship • Deploy at South Pole • VUV: • Cylinder calibrations • Airborne industrial, terrestrial, oceanic, and stratospheric studies • Wind-tunnel studies of aircraft inlet fractionation • Eddy-correlation measurements of air-sea O2 fluxes