Download
1 / 27
540 likes | 1.57k Views
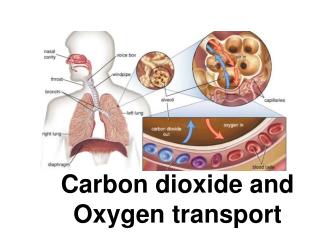
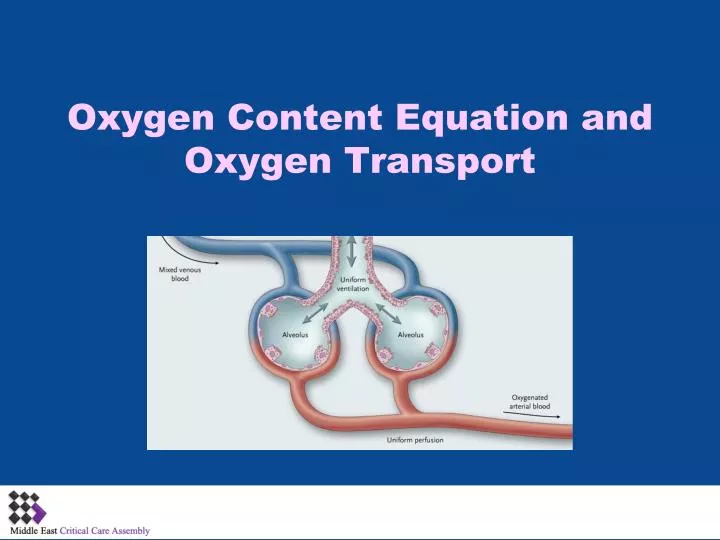
Oxygen Content Equation and Oxygen Transport. The Key to Blood Gas Interpretation: Four Equations, Three Physiologic Processes. Equation Physiologic Process 1) PaCO2 equation Alveolar ventilation 2) Alveolar gas equation Oxygenation 3) Oxygen content equation Oxygenation

E N D
The Key to Blood Gas Interpretation:Four Equations, Three Physiologic Processes EquationPhysiologic Process 1) PaCO2 equation Alveolar ventilation 2) Alveolar gas equation Oxygenation 3) Oxygen content equation Oxygenation 4) Henderson-Hasselbalch equation Acid-base balance These four equations, crucial to understanding and interpreting arterial blood gas data.
Severe tissue hypoxia due to capillary microthrombosis in critically ill patient with meningococcal septicaemia
Clinical Features of Tissue Hypoxia Dyspnoea Altered mental state Tachypnoea or hypoventilation Arrhythmias Peripheral vasodilatation Systemic hypotension Coma Cyanosis (unreliable) Nausea, vomiting, and gastrointestinal disturbance
Oxygen Delivery DO2=COXCaO2
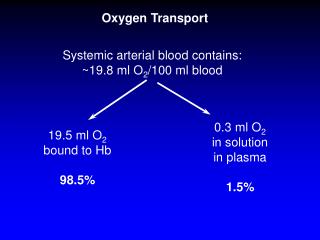
Oxygen Content (CaO2) CaO2=[(1.34 x Hgbx SaO2) + (0.003 x PaO2) Quantity O2 bound to Hemoglobin Quantity O2 dissolved in plasma (units = ml O2/dl)
Determinants of Oxygen Delivery O2 Capacity CaO2= [(1.34 x Hgbx SaO2) + (0.003 x PaO2) O2 Binding O2 Dissolved X Preload Afterload Contractility
Effect of oxygen tension gradient and diffusion distance on availability of oxygen to cells
Factors affecting extraction ratio of oxygen from capillary blood Rate of oxygen delivery to the capillary Oxygen-haemoglobin dissociation relation Size of the capillary to cellular P O2 gradient Diffusion distance from the capillary to the cell Rate of use of oxygen by cells
Oxygen Dissociation Curve: SaO2 vs. PaO2 CO and metHb do not affect PaO2, but do lower the SaO2 (Mesuredvs calculated). Also shown are CaO2 vs. PaO2 for two different hemoglobin contents: 15 gm% and 10 gm%. CaO2 units are ml O2/dl. P50 is the PaO2 at which SaO2 is 50%.
Causes of Hypoxia Lung Disease: Shunt or V-Q imbalance Reduced PaO2 ↓O2 Binding ↓ CaO2= [(1.34 x Hgbx SaO2) + (0.003 x PaO2) ↓O2 Dissolved X
Causes of Hypoxia • Carbon monoxide poisoning Methemoglobinemia, • Rightward shift of the O2-dissociation curve Reduced SaO2 ↓O2 Binding ↓ CaO2= [(1.34 x Hgbx SaO2) + (0.003 x PaO2) X
Causes of Hypoxia • Anemia Reduced Hgb ↓O2 Capacity ↓ CaO2= [(1.34 x Hgbx SaO2) + (0.003 x PaO2) X
Causes of Hypoxia • Reduced cardiac output: • shock, congestive heart failure • Left-to-right systemic shunt: septic shock CaO2= [(1.34 x Hgbx SaO2) + (0.003 x PaO2) X ↓DO2 Delivery
Causes of Hypoxia • Hypothermia. Hypophosphatemia, alkalosis and CO intoxication
Effect of intercapillary distance on relation between oxygen delivery and consumption when delivery is reduced by hypoxia (a fall in Pa O 2), reduced flow (stagnant),and anaemia (fall in haemoglobin concentration) • Interstitial Edema
Causes of Hypoxia CaO2= [(1.34 x Hgbx SaO2) + (0.003 x PaO2) X • ↓Tissue Uptake VO2 • Mitochondrial poisoning (e.g., cyanide poisoning) • Left-shifted hemoglobin dissociation curve (e.g., from acute alkalosis, excess CO, or abnormal hemoglobin structure
SaO2 and CaO2: Test Your Understandingwhich patient, (1) or (2), is more hypoxic The oxygen contents are almost identical, and therefore neither patient is more hypoxemic. However, patient (1), with 20% CO, is more hypoxic than patient (2) because of the left-shift of the O2-dissociation curve caused by the excess CO. 1) Hb 15, PaO2 100, pH 7.40, COHb 20%: CaO2= .78 x 15 x 1.34 = 15.7 ml O2/dl 2) Hb 12, PaO2 100, pH 7.40, COHb 0 CaO2= .98 x 12 x 1.34 = 15.8 ml O2/dl
SaO2 and CaO2: Test Your Understandingwhich patient, (1) or (2), is more hypoxic A PaO2 of 90 mm Hg with pH of 7.20 gives an SaO2 of @ 92%; subtracting 5% COHb from this value gives a true SaO2 of 87%, used in the CaO2 calculation of patient (1). A PaO2 of 50 mm Hg with normal pH gives an SaO2 of 85%. Thus patient (2) is slightly more hypoxemic 1) Hb 15, PaO2 90, pH 7.20, COHb 5% CaO2= .87 x 15 x 1.34 = 17.5 ml O2/dl 2) Hb 15, PaO2 50, pH 7.40, COHb 0 CaO2= .85 x 15 x 1.34 = 17.1 ml O2/dl
SaO2 and CaO2: Test Your Understandingwhich patient, (1) or (2), is more hypoxemic Patient (1) is more hypoxemic, because of severe anemia. 1) Hb 5, PaO2 60, pH 7.40, COHb 0 CaO2= .90 x 5 x .1.34 = 6.0 ml O2/dl 2) Hb 15, PaO2 100, pH 7.40, COHb 20% CaO2= .78 x 15 x 1.34 = 15.7 ml O2/dl
SaO2 and CaO2: Test Your Understandingwhich patient, (1) or (2), is more hypoxemic Patient (1) is more hypoxemic. 1) Hb 10, PaO2 60, pH 7.30, COHb 10% CaO2= .87 x 10 x .1.34 = 11.7 ml O2/dl 2) Hb 15, PaO2 100, pH 7.40, COHb 15% CaO2= .83 x 15 x 1.34 = 16.7 ml O2/dl
Factors Affecting Metabolic Rate • Increased rate • Temperature—oxygen demand increases 10-15% for every 1£C rise • Sepsis or systemic inflammatory response syndrome • Size of the capillary to cellular P O2 gradient • Burns, trauma, surgery • Sympathetic activation: pain, agitation, shivering • Interventions: nursing procedures, physiotherapy, visitors • β agonists, amphetamines, and tricyclic antidepressants • Feeding regimens containing excessive glucose • Decreased rate • Sedatives, analgesics, and muscle relaxants
Clinical goals for anagementof Regional Oxygen Delivery Maintain adequate perfusion pressure and oxygen delivery to ensure regional delivery Maintain Pa O 2 above 7-8 kPa Minimise tissue oedema without causing intravascular depletion (use of colloids) Reduce tissue oxygen demand by reducing metabolic rate