Download
1 / 53
530 likes | 659 Views
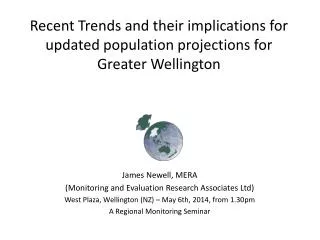
A discussion of updated statistics, estimates and projections for Wellington and their interpretation. Is Wellington on the critical list….?. James Newell, MERA ( Monitoring and Evaluation Research Associates Ltd) www.mera.co.nz Backbencher, Wellington 19 th -July 2013 (edited). Motivation.

E N D
A discussion of updated statistics, estimates and projections for Wellington and their interpretation Is Wellington on the critical list….? James Newell, MERA (Monitoring and Evaluation Research Associates Ltd) www.mera.co.nz Backbencher, Wellington 19th-July 2013 (edited)
Motivation • My own bit of navel gazing in reaction to the PM’s challenge… • Challenge myself to contribute some evidence (quick estimates …. on? • Population (easiest) • Jobs / industries • What can be said on … amalgamation, infrastructure … from regional science
Some Evidence • Wellington functional versus administrative geography … community commuting • Regional shift share analysis –2009-2012 .. • Population change and communities … Population est, PLT External Migrflows • Detail of population diversity …. through the children (admin data)
Spatial linkages - labour market geography - the Wellington region
A labour market catchment industry cluster type view of the Lower North Island
Wellington Maps – dot densityeach red dot = 5 jobseach green dot=5 residents
Wellington defns? Local communitiessource?Not sure – but look good – not area unit based unfortunately
Shift Share Analysis • Shift-Share Analysis following Dune (1960) • Where E represents employment • time is t, industry is i and region is j • NE represents National Employment Change Effect, • IM represents the Industry Mix Effect and • CE represents the Regional Competitive Effect.
Putting it simply.. • National Employment Change Effect (NE) – represents the overall rate of change in national employment over a given period • Industry Mix Effect (IM) – represents the expected rate of change due to the mix of industries in a particular area over a given period • Regional Competitive Effect (CE) represents the difference from what would be expected changes in national employment and national trends in employment by industry ..
Regional Competitive Effect (CE)? • represents the difference between actual change and what would have been expected for a given area and period from national employment overall and by industry .. • This effect could be a result of • investment by government or the private sector favouring particular industries in a region (including infrastructure roads etc.) • Better economic performance /productivity of particular industries in a given region compared with others
Wellington Region : FTE Shift Share Trends Summary : Industry Level 3 (purple is Bus Demog)
Wellington Region : FTE Shift Share Trends Summary : Industry Level 3
Auckland Region : FTE Shift Share Trends Summary : Industry Level 3
Regional Competitive effect (# and as % of start jobs) – 2006-2009
Regional Competitive effect (# and as % of start jobs) – 2009-2012
Wellington Regional Competitive Effect 2009-2012 as % of Start Industry FTE (high % effects)
Wellington Regional Competitive Effect 2009-2012 (high # effects)
Wellington Regional Competitive Effect 2009-2012 as % of Start Industry FTE (low % effects)
Wellington Regional Competitive Effect 2009-2012 (low # effects)
Auckland - Industry Shift Share Case Study : Restaurants Cafes and Other Eating and Drinking Places
Regional Competitive Effect as % : Restaurants Cafes and Other Eating and Drinking Places
Summing up • Wellington normally has a small “regional competitive effect”…. against the region … Auckland normally has a gain in jobs from a net regional competitive gain (but had a – ve CE over 2006-2009) • The 2009-2012 period saw a slightly higher than average (for 1981 – 2012) loss of jobs due to a regional competitive effect – but negative competitive effect estimated to have been highest over 1991-1996 and 2001-2006 – corresponding to periods when the growth in national jobs was very high
Summing up on Shift Share .. • Selected industry level rgl competitive effects identified • The 2009-2012 period saw a slightly higher than average (for 1981 – 2012) loss of jobs due to a regional competitive effect – but negative competitive effect estimated to have been highest over 1991-1996 and 2001-2006 – corresponding to periods when the growth in national jobs was very high • Regional CE overall is the sum of industry level CE effects over 2009-2012 – • +ve effects …. Creative and performing arts, beverage manufacturing …. • -ve effects …. Employment services, defence, postal and courier pickup and delivery services..
Permanent long term international migration – as a 12 months moving average..A simple seasonal adjustment
Wellington Urban TA’s - Permanent Long Term Migration – 12 mths moving average
New Zealand- Permanent Long Term Migration – 12 mths moving average
Greater Auckland - Permanent Long Term Migration – 12 mths moving average
Canterbury Urban TA’s - Permanent Long Term Migration – 12 mths moving average
Ethnic Composition of Children at Wellington Regional Schools (July roll, %)
Some points for Wellington • A stable long term growth rate • generally not as susceptible to the extremes of international and domestic highs and lows as Auckland and Christchurch • generally lower than Greater Auckland and Greater Christchurch • on a par with the North Island excluding Auckland • higher the South Island excl Christchurch
Cohort aging in place – Wellington by year of age 1981 - 2006
Components of Population Change 2006-2011 Regional Comparisons
Summing up (1) – any recent evidence of Wellington on the critical list? • On industry shift share analysis – • Small loss to jobs from an overall negative regional competitive • Slightly higher than 1981-2012 loss of jobs to Welly due to a net regional competitive effect summed for all industries • No evidence of any major change from long term trends • Story of the relative performance of the Wellington region worth looking at more carefully to see winners and losers over time and how well Wellington is positioned in terms of growth industries