Download
1 / 16
160 likes | 321 Views
The New Energy Landscape. Janice Hager, Vice President, Integrated Resource Planning and Analytics. Duke Energy: scale, diversity and flexibility. USFE&G geographic diversity (1). Largest utility in the United States (1). Total assets: ~$114 billion

E N D
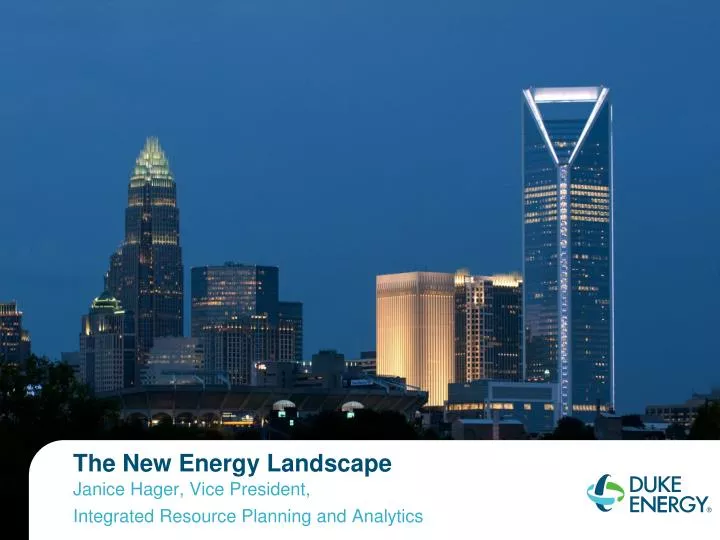
The New Energy Landscape Janice Hager, Vice President, Integrated Resource Planning and Analytics
Duke Energy: scale, diversity and flexibility USFE&G geographic diversity (1) Largest utility in the United States (1) • Total assets: ~$114 billion • Market capitalization: ~ $47 billion • U.S. generation capacity: ~ 58 GW diversified portfolio • Electric customers: 7.2 million Midwest Carolinas Highly-regulated business with earnings diversity (2) Pre-Merger Post-Merger 3% Florida USFE&G fuel diversity (MWh output) (3) 38% 2005 2015 55% Commercial Power International USFE&G Coal Nuclear (1) Total assets, US generation capacity, and electric customers as of June 30, 2013; market cap as of Aug. 30, 2013 Natural Gas (2) Pre-merger business mix based upon 2011 Duke Energy adjusted net income; post-merger business mix based upon midpoint of 2013 adjusted diluted EPS guidance range of $4.20 - $4.45; all amounts exclude “Other” (3) 2005 represents pro-forma regulated generation combining Duke Energy and Progress Energy. Crystal River 3 excluded from 2015. Assumes CR1-2 retirement, (no definitive decision has been made), but does not assume replacement generation Oil Hydro
Integrated Resource Planning IRP Objectives
Resource Options – Coal & Nuclear COAL NUCLEAR
Resource Options – Natural Gas and Hydroelectric NATURAL GAS HYDRO
Resource Options – Solar, Wind, and Energy Efficiency SOLAR WIND ENERGY EFFICIENCY
Public Policy Issues • Greenhouse gas (climate change) • EPA Regulations • Congressional Action? • Cap and Trade • Clean Energy Standard legislation • Renewable resource • Renewable portfolio standards (with or without energy efficiency standards) • Tax incentives (investment tax credits or production tax credits) • Nuclear • Influenced by Greenhouse Gas legislation • Tax incentives • Waste disposal
Solar Resource Capacity Contribution Coincidence with System Peak ILLUSTRATIVE system peak solar peak 40% coincidence 0% coinci- dence 0% coinci- dence Hour of the day Hour of the day PJM ascribes 38% capacity credit to solar 12
Shale Gas Developments – Estimated Growth by Basin Estimated growth of nearly 25 Bcf/d from 2005 to 2013 • shale gas production (dry) • billion cubic feet per day
Shale Gas Becomes the Future of US Supply (in trillion cubic feet) 2006 View 2013 View Shale Gas Net Pipeline Imports Other
Changing Long Term Natural Gas Market Prices Natural Gas Price ($/mmBtu)
Changing Natural Gas Supply • Majority of historical gas supply originated in Gulf • Evolution of shale gas in last 5 years has been a game changer • As a result, sourcing and market has changed significantly