Download
1 / 43
430 likes | 512 Views
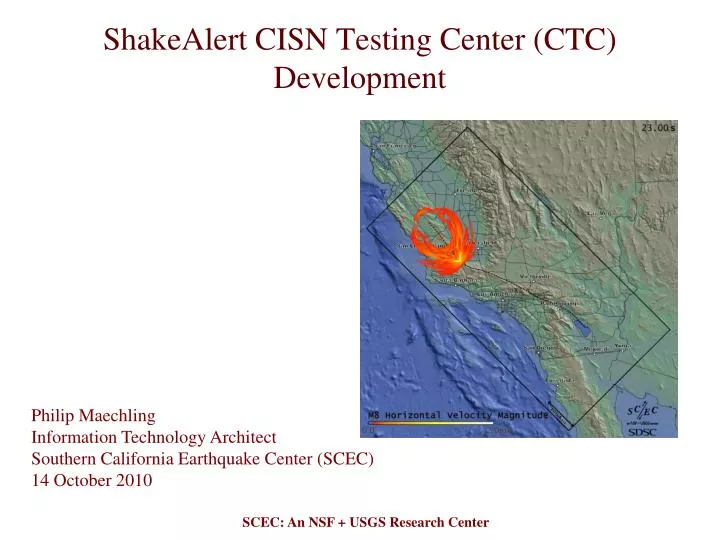
ShakeAlert CISN Testing Center (CTC) Development. Philip Maechling Information Technology Architect Southern California Earthquake Center (SCEC) 14 October 2010. CTC Progress in 2010.

E N D
ShakeAlert CISN Testing Center (CTC) Development Philip MaechlingInformation Technology ArchitectSouthern California Earthquake Center (SCEC)14 October 2010 SCEC: An NSF + USGS Research Center
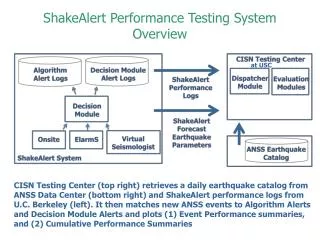
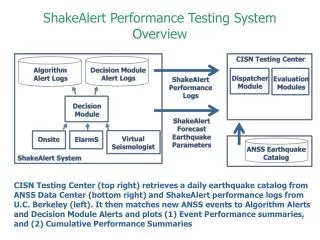
CTC Progress in 2010 • Operating algorithm evaluation system with California-based performance reports and raw data available (2008-present). • Changed our automated software testing infrastructure from web-based (Joomla) system to server-based (CSEP) system. • Added ShakeMap RSS reader into CSEP for use as a source of authorized observational data that will be used to evaluate earthquake parameter and ground motion forecasts. • Implemented a prototype EEW forecast evaluation test as plotting of PGV used in ShakeMaps for each event. • Began nightly automated retrieval of observational data from ShakeMap RSS and create observation-based ground motion maps. • Started implementation of ground motion forecast evaluation defined in 2008 CISN Testing Document.
EEW Testing Center Provides On-going Performance Evaluation • Performance summaries available through login (www.scec.org/eew) • Evaluation results for 2010 include 144 M4+ earthquakes in CA Testing Region • Cumulative raw summaries (2008-present) posted at (scec.usc.edu/scecpedia/Earthquake_Early_Warning)
CTC Progress in 2010 • Operating algorithm evaluation system with California-based performance reports and raw data available (2008-present). • Changed our automated software testing infrastructure from web-based (Joomla) system to server-based (CSEP) system. • Added ShakeMap RSS reader into CSEP for use as a source of authorized observational data that will be used to evaluate earthquake parameter and ground motion forecasts. • Implemented a prototype EEW forecast evaluation test as plotting of PGV used in ShakeMaps for each event. • Began nightly automated retrieval of observational data from ShakeMap RSS and create observation-based ground motion maps. • Started implementation of ground motion forecast evaluation defined in 2008 CISN Testing Document.
CISN Testing Center (CTC) Forecast Evaluation Processing System ShakeMap RSS Feed Ground Motion Observations Retrieve Filter Data Catalog Observed ANSS EQ Parameter and Ground Motion Data Filtered Earthquake Earthquake Catalog Catalog ANSS Earthquake Catalog Evaluation tests comparing Forecasts and Observations ShakeAlert Earthquake Parameter Forecast CISN Decision Modules Load Reports ShakeAlert Ground Motion Forecast ShakeAlert Forecast Information CISN User Modules CISN EEW Testing Center (CTC) and Web Site
CTC Progress in 2010 • Operating algorithm evaluation system with California-based performance reports and raw data available (2008-present). • Changed our automated software testing infrastructure from web-based (Joomla) to server-based (CSEP) system. • Added ShakeMap RSS reader into CSEP for use as a source of authorized observational data that will be used to evaluate earthquake parameter and ground motion forecasts. • Implemented a prototype EEW forecast evaluation test as plotting of PGV used in ShakeMaps for each event. • Began nightly automated retrieval of observational data from ShakeMap RSS and create observation-based ground motion maps. • Started implementation of ground motion forecast evaluation defined in 2008 CISN Testing Document.
CTC Progress in 2010 • Operating algorithm evaluation system with California-based performance reports and raw data available (2008-present). • Changed our automated software testing infrastructure from web-based (Joomla) to server-based (CSEP) system. • Added ShakeMap RSS reader into CSEP for use as a source of authorized observational data that will be used to evaluate earthquake parameter and ground motion forecasts. • Implemented a prototype EEW forecast evaluation test as plotting of PGV used in ShakeMaps for each event. • Began nightly automated retrieval of observational data from ShakeMap RSS and create observation-based ground motion maps. • Started implementation of ground motion forecast evaluation defined in 2008 CISN Testing Document.
CTC Progress in 2010 • Current ShakeAlert CTC retrieves ShakeMap RSS data and plots observations for all Mag 3.0+ earthquakes in California Testing Region as shown (left).
CTC Progress in 2010 • Operating algorithm evaluation system with California-based performance reports and raw data available (2008-Present) • Changed our automated software testing infrastructure from web-based (Joomla) to server-based (CSEP) system. • Added ShakeMap RSS reader into CSEP for use as a source of authorized observational data that will be used to evaluate earthquake parameter and ground motion forecasts. • Implemented a prototype EEW forecast evaluation test as plotting of PGV used in ShakeMaps for each event. • Began nightly automated retrieval of observational data from ShakeMap RSS and create observation-based ground motion maps. • Started implementation of ground motion forecast evaluation defined in 2008 CISN Testing Document.
CISN Testing Center (CTC) Forecast Evaluation Processing System ShakeMap RSS Feed Ground Motion Observations Retrieve Filter Data Catalog Observed ANSS EQ Parameter and Ground Motion Data Filtered Earthquake Earthquake Catalog Catalog ANSS Earthquake Catalog Evaluation tests comparing Forecasts and Observations ShakeAlert Earthquake Parameter Forecast CISN Decision Modules Load Reports ShakeAlert Ground Motion Forecast ShakeAlert Forecast Information CISN User Modules CISN EEW Testing Center (CTC) and Web Site
CTC Progress in 2010 • Operating algorithm evaluation system with California-based performance reports and raw data available (2008-Present) • Changed our automated software testing infrastructure from web-based (Joomla) to server-based (CSEP) system. • Added ShakeMap RSS reader into CSEP for use as a source of authorized observational data that will be used to evaluate earthquake parameter and ground motion forecasts. • Implemented a prototype EEW forecast evaluation test as plotting of PGV used in ShakeMaps for each event. • Began nightly automated retrieval of observational data from ShakeMap RSS and create observation-based ground motion maps. • Started implementation of ground motion forecast evaluation defined in 2008 CISN Testing Document.
CTC Progress in 2010 Initial CTC Evaluation Test is defined in 2008 CISN EEW Testing Document (as updated July 2010). Previous Algorithm Testing Center did not implement this summary. Access to ShakeMap RSS ground motion observations makes automated implementation practical.
Scientific and Technical Coordination Issues • Prioritization of forecast evaluation tests to be implemented • SCEC science planning of EEW forecast evaluation experiments • Use of EEW in time-dependent PSHA information • Consider Extending ShakeMap format as CAP-based forecast exchange format. • Send forecasts information (and time of report) to produce: • ShakeMap Intensity Maps • ShakeMap Uncertainties Maps • Consider ShakeAlert interfaces to support comparative EEW performance tests. Provide access to information for each trigger: • Stations Used In Trigger • Stations Available when declaring Trigger • Software Version declaring Trigger
Design of an Experiment Rigorous CISN EEW testing will involve the following definitions: • Define a forecast • Define testing area • Define input data used in forecasts • Define reference observation data • Define measures of success for forecasts
Proposed Performance Measures Summary Reports for each M ≥ M-min: Key documents is 3 March 2008 document which specifies six types of tests. • Summary 1: Magnitude • Summary 2: Location • Summary 3: Ground Motion • Summary 4: System Performance • Summary 5: False Triggers • Summary 6: Missed Triggers
Experiment Design Summary 1.1: Magnitude X-Y Diagram Measure of Goodness: Data points fall on diagonal line Relevant: T2,T3,T4 Drawbacks: Timeliness element not represented Which in series of magnitude estimates should be used in plot.
Experiment Design Summary 1.2: Initial magnitude error by magnitude Measure of Goodness: Data points fall on horizontal line Relevant: T2,T3,T4 Drawbacks: Timeliness element not represented
Experiment Design Summary 1.3: Magnitude accuracy by update Measure of Goodness: Data points fall on horizontal line Relevant: T3,T4 Drawbacks: Timeliness element not represented
Proposed Performance Measures Summary Reports for each M ≥ M-min: Key documents is 3 March 2008 document which specifies six types of tests. • Summary 1: Magnitude • Summary 2: Location • Summary 3: Ground Motion • Summary 4: System Performance • Summary 5: False Triggers • Summary 6: Missed Triggers
Experiment Design Summary 2.1:Cumulative Location Errors Measure of Goodness: Data points fall on vertical zero line Relevant: T3, T4 Drawbacks: Does not consider magnitude accuracy or timeliness
Experiment Design Summary 2.2: Magnitude and Location error by time after origin Measure of Goodness: Data points fall on horizontal zero line Relevant: T3, T4 Drawbacks: Event-specific not cumulative
Proposed Performance Measures Summary Reports for each M ≥ M-min: Key documents is 3 March 2008 document which specifies six types of tests. • Summary 1: Magnitude • Summary 2: Location • Summary 3: Ground Motion • Summary 4: System Performance • Summary 5: False Triggers • Summary 6: Missed Triggers
Experiment Design Summary 3.1 : Intensity Map Comparisons Measure of Goodness: Forecast map matches observed map Relevant: T4 Drawbacks: Not a quantitative results
Experiment Design Summary 3.2: Intensity X-Y Diagram Measure of Goodness: Data points fall on diagonal line Relevant: T1,T2,T4 Drawbacks: Timeliness element not represented Which in series of intensity estimate should be used in plots T3.
Experiment Design Summary 3.3: Intensity Ratio by Magnitude Measure of Goodness: Data points fall on horizontal line Relevant: T1,T2,T4 Drawbacks: Timeliness element not represented Which intensity estimate in series should be used in plot.
Summary 3.3: Predicted to Observed Intensity Ratio by Distance and Magnitude Measure of Goodness: Data points fall on horizontal line Relevant: T1,T2,T4 Drawbacks: Timeliness element not represented Which intensity estimate in series should be used in plot.
Summary 3.3: Evaluate Conversion from PGV to Intensity Group has proposed to evaluate algorithms by comparing intensities and they provide a formula for conversion to Intensity.
Summary 3.4: Evaluate Conversion from PGV to Intensity Group has proposed to evaluate algorithms by comparing intensities and they provide a formula for conversion to Intensity.
Experiment Design Summary 3.5: Statistical Error Distribution for Magnitude and Intensity Measure of Goodness: No missed events or false alarms in testing area Relevant: T4 Drawbacks:
Experiment Design Summary 3.6: Mean-time to first location or intensity estimate (small blue plot) Measure of Goodness: Peak of measures at zero Relevant: T1,T2,T3,T4 Drawbacks: Cumulative and does not involve accuracy of estimates
Proposed Performance Measures Summary Reports for each M ≥ M-min: Key documents is 3 March 2008 document which specifies six types of tests. • Summary 1: Magnitude • Summary 2: Location • Summary 3: Ground Motion • Summary 4: System Performance • Summary 5: False Triggers • Summary 6: Missed Triggers
Experiment Design No examples for System Performance Summary defined as Summary 4.1: Ratio of reporting versus non-reporting stations:
Proposed Performance Measures Summary Reports for each M ≥ M-min: Key documents is 3 March 2008 document which specifies six types of tests. • Summary 1: Magnitude • Summary 2: Location • Summary 3: Ground Motion • Summary 4: System Performance • Summary 5: False Triggers • Summary 6: Missed Triggers
Experiment Design Summary 5.1: Missed event and False Alarm Map Measure of Goodness: No missed events or false alarms in testing area Relevant: T3, T4 Drawbacks: Must develop definitions for missed events and false alarms, Does not reflect timeliness
Experiment Design Summary 5.2: Missed event and False Alarm Map Measure of Goodness: No missed events or false alarms in testing area Relevant: T3, T4 Drawbacks: Must develop definitions for missed events and false alarms, Does not reflect timeliness
Proposed Performance Measures Summary Reports for each M ≥ M-min: Key documents is 3 March 2008 document which specifies six types of tests. • Summary 1: Magnitude • Summary 2: Location • Summary 3: Ground Motion • Summary 4: System Performance • Summary 5: False Triggers • Summary 6: Missed Triggers
Experiment Design Summary 6.1: Missed Event map Measure of Goodness: No missed events in testing region Relevant: T3, T4 Drawbacks: Must define missed event. Does not indicate timeliness