Download
1 / 21
210 likes | 219 Views
Learn about the various graphical modeling techniques used in systems engineering to visualize and predict how large systems will interact. This chapter covers state diagrams, data modeling, process modeling, behavior modeling, and object-oriented modeling.

E N D
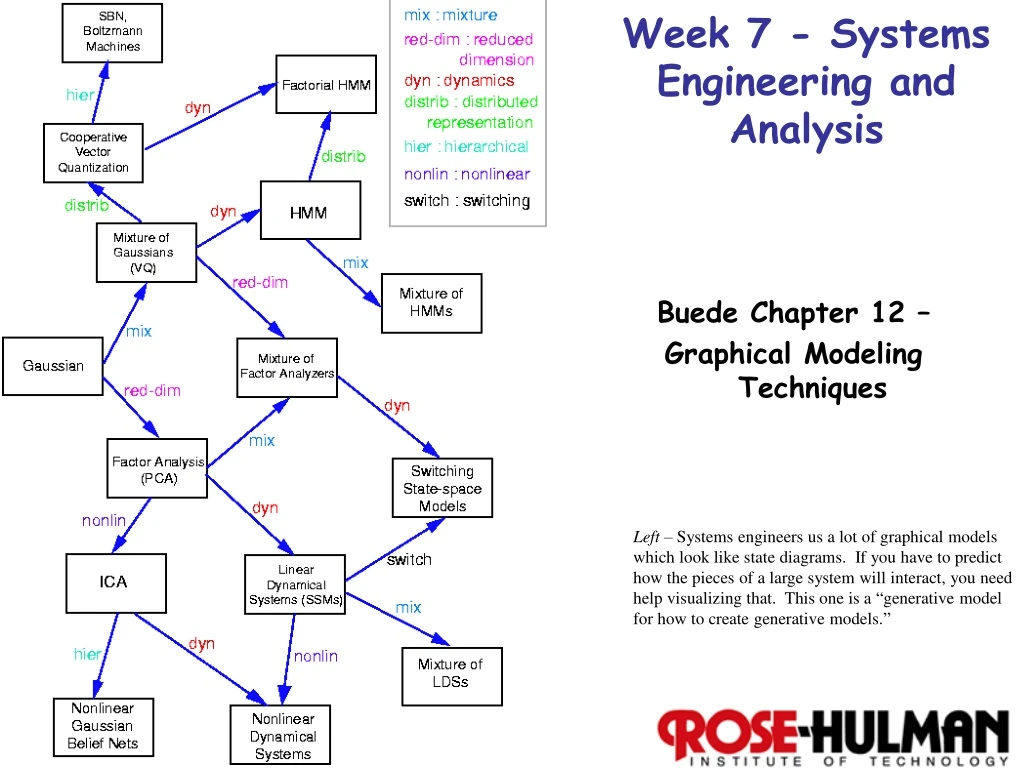
Week 7 - Systems Engineering and Analysis Buede Chapter 12 – Graphical Modeling Techniques Left – Systems engineers us a lot of graphical models which look like state diagrams. If you have to predict how the pieces of a large system will interact, you need help visualizing that. This one is a “generative model for how to create generative models.”
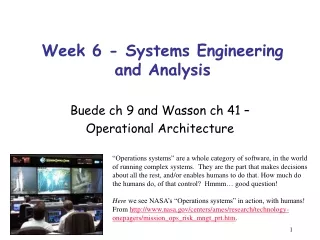
Wasson also talks about modeling Mostly scattered by topic – what you are modeling. E.g., Sec 15.2 – System behavioral response model Ch 17 – Use Cases & UML Ch 20 – Modeling system and support operations Ch 51 – System modeling and simulation
Data, Process, and Behavior Models • Data Models – relationships among input and outputs. • Process Models – define functional decomposition of the system function and flow of inputs and outputs for those functions. • Behavior Models – define the control, activation, and termination of of system functions needed to meet performance requirements.
Modeling Approaches & Methods • Data Modeling • Entity-relationship diagrams (ERDs) • Higraphs • Process Modeling • Data flow diagrams (DFDs) • IDEF0 • N2 charts • Behavior Modeling • Function flow block diagrams (FFBDs) • Behavior diagrams (BDs) • State-transition diagrams (STDs) • Statecharts • Control flow diagrams (CFDs) • Petri nets (PNs) • Object-oriented Modeling • Object modeling technique (OMT) • Real-time object-oriented modeling (ROOM) Table 12.1
Data Flow Diagram Semantics Figure 12.6
Context (External Systems) Diagram in DFD Figure 12.9
N2 Charts – an SE favorite! Figure 12.10
Concurrent Function Flow Block Diagrams • Basic • Series • Concurrent • Selection • Multiple-exit function • Enhanced • Iteration • Looping • Replication Series Figure 12.11-12
Selection & Multiple-exit Functions, Iteration, Looping in FFBD Figure 12.13
Behavior Diagrams Figure 12.14
Finite State Machines • Finite state machines: discrete valued inputs, outputs and internal items • Sequential: past inputs impact current outputs (e.g., state-transition diagram) • Combinational: current outputs characterized only current inputs • Continuous machines: continuous and discrete inputs, outputs and internal items Figure 12.16
State-transition Diagram for ATM Event Output Partially Completed Figure 12.17
State-transition Diagram for an Elevator Figure 12.18
Statechart External System Statechart For Cruise Control System Figure 12.19
Statechart, cntd Decomposition of the “Not Off” State For Cruise Control System Figure 12.20
Statechart, cntd Decomposition of the “Alive” State for the Indicator of Cruise Control System Figure 12.21
Statechart, cntd Decomposition of the “On” State for the Indicator of Cruise Control System Figure 12.22
Statechart for Cruise Control System Figure 12.23
Object-oriented Modeling – our favorite in software? • Object Modeling Technique (OMT) • Object model (ERD) • Dynamic model (STD & nested state diagrams) • Functional model (DFD) • Real-time Object-oriented Modeling (ROOM) • Objects = Actors • Actors communicate via messages • ROOMcharts • Combine functional and behavioral models • Generalization of Statecharts • Unified Modeling Language (UML) (SysML)