Download
1 / 16
160 likes | 254 Views
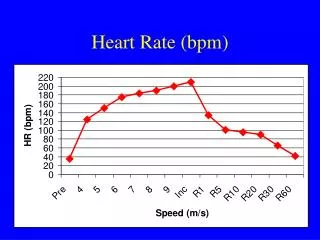
Heart Rate. Some of the ‘Heart Rate’ Data. Some of the ‘Heart Rate’ Data. Take a look at the data so you have some ideas to start with. Get an idea about the type of question you might like to answer. Possible questions.

E N D
Some of the ‘Heart Rate’ Data • Take a look at the data so you have some ideas to start with. • Get an idea about the type of question you might like to answer.
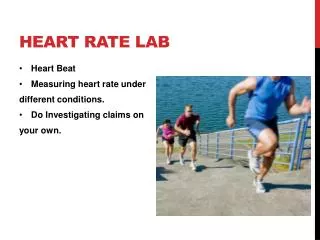
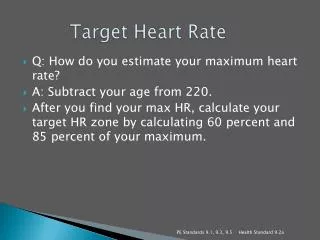
Possible questions • Is there a relationship between the number of beats/min before and after the students had stepped up and down on a block of a fixed height? • How does the heart rate change after exercising?
Comment on the statistics • Comment on the Central Tendencies:
Comment on the statistics • The mean increased by 26.3 beats/min but the median increased by 18 beats/min. This suggests that there are extreme values and the median would be a better measurement an ‘average’ increase. • The mode has little meaning in this context.
Comment on the statistics • Now comment on the spread.
Comment on the statistics • The range of values for the final increased by 42 (probably due to extreme values). • The IQR would give a better measure of spread as the increase was only 12.
Appropriate graphs • If we are comparing values, a box and whisker plot would show this.
Comments • These plots show that there has been a marked increase in heart rate after the exercise. • All three measures: Median, LQ and UQ have increased. • As the boxes do not overlap, the increase can be considered to be significant.
Comments • Both the range and interquartile range have increased showing an increase in the spread of the data.
If you are looking for a relationship between variables a scatterplot shows the relationship.
If you are looking for a relationship between variables a scatterplot shows the relationship. • The relationship between resting and final heart rate is a positive linear relationship. • The gradient of the line suggests that we could expect on average a 1.12 beats/min increase in heart rate for every 1 beat/min increase in the resting heart rate.
Evaluation • 30 volunteers were found from among the student’s friends. • Because the survey was done using volunteers, it may not represent the population as a whole. • The student’s friends may be more or less physically able than the general student population.