Download
1 / 11
110 likes | 216 Views
Analysis of Current Signal Effectiveness on SW Broadway. By: Max Gummer Jonathan Horowitz Brandon McVeigh Edward Kreipe. PSU- Oregon’s largest University. High trip generation with PSU as destination Multi - modal commuters Bikes, pedestrians, busses, automobiles.

E N D
Analysis of Current Signal Effectiveness on SW Broadway By: Max Gummer Jonathan Horowitz Brandon McVeigh Edward Kreipe
PSU- Oregon’s largest University • High trip generation with PSU as destination • Multi - modal commuters • Bikes, pedestrians, busses, automobiles
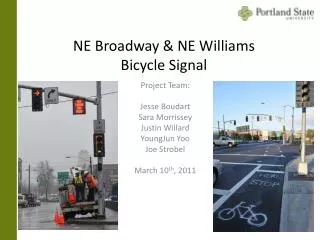
Types of signals in study site • SW Broadway • 3 lane, one way street with fully signalized 3 section head (r,y,g) • 4 minor street intersections • Mill - 3 section head signal • Hall and Harrison - flashing yellow • Montgomery - stop sign
Possible Conflicts • Danger to pedestrians on south side of Broadway at each intersection • Especially at high pedestrians flows (i.e lunchtime) • Stop sign on Montgomery • Creates dangerous merge onto Broadway • parked cars on Broadway Blocks line of site • Dangerous to pedestrians • Drivers looking at oncoming traffic and not at crosswalk • Blinking yellow on Hall and Harrison • People not used to it, don’t know what to do.
Objective Of Study • Determine how well current intersection signal configurations are working • Determine possible changes • Will increase in population change anything? • Observed data • Traffic and pedestrian counts • Data analysis • Syncro 6 software - determine LOS
Data Collection Strategy • Wanted to calculate control delay and LOS • Needed vehicle and pedestrian counts to determine PH and PHF • 3 vehicle movements and 3 pedestrian movements
Syncro 6 Traffic Analysis software (available in the ITS lab) Used to create a virtual network of study area. All relevant data can be entered and changed. Various reports can be complied.
Conclusion • Adequate LOS for all intersections for all time periods. • While the stop sign and flashing light are able to accommodate traffic, safety considerations are still substantial • Poor visibility for stop sign • Unfamiliarity and poor visibility for flashing yellow. • Our recommendation: change flashing yellow and stop sign to full 3 head signals.