Download
1 / 39
390 likes | 405 Views
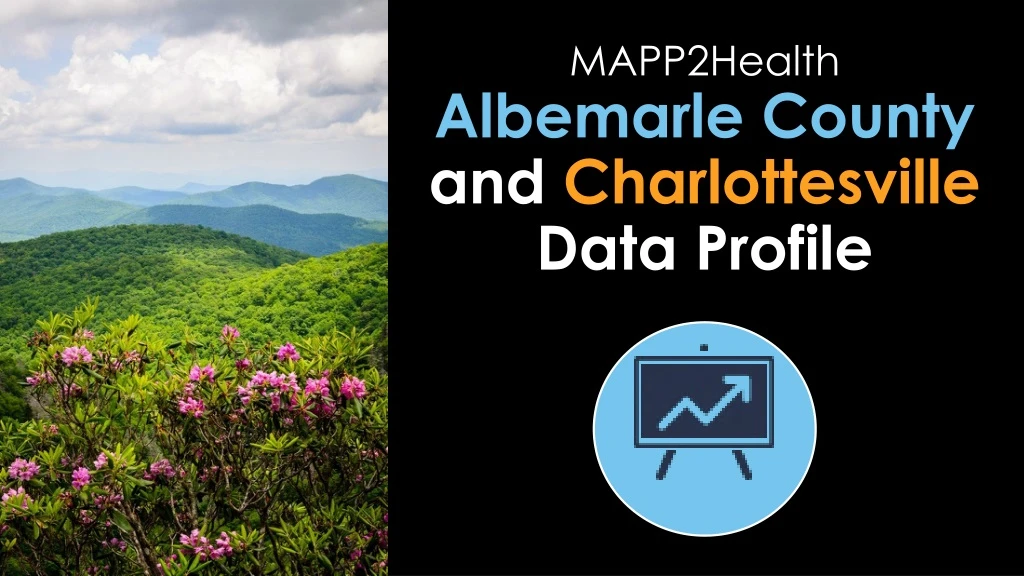
Explore health data posters on obesity, mental health, substance use, and more in Albemarle County and Charlottesville. Identify trends and disparities to promote well-being.

E N D
What do you see? Spend 5-7 minutes walking around and looking at the data posters. Add your stars: • Blue = What stands out to you? • Green = Do you see any differences in the data (better/worse outcomes) by geography, race, age, gender, etc.? • Yellow= Is there a topic where you’d like to see more data or have more discussion?
MAPP Data Available Online:https://public.tableau.com/profile/thomas.jefferson.health.district#!/ Mapping the Prevalence of Obesity in TJHD (2014-2016) Life Expectancy Estimates at Birth by Census Tract (2008-2012)
Percent of Obese Adultsby TJHD Locality, 2005-2015. Source: Robert Wood Johnson Foundation (RWJF), County Health Rankings, 2018. Healthy People 2020 Benchmark = 30.5%
Percent of Obese Adults by TJHD Zip Code Tabulation Area, 2016. Source: Translational Health Research Institute of Virginia (UVA Clinical Data Repository), 2017.
Percent of Obese Children by TJHD Zip Code Tabulation Area, 2016. Source: Translational Health Research Institute of Virginia (UVA Clinical Data Repository), 2017.
Percent of Adult Physical Inactivity, by TJHD Locality, 2005-2015. Source: Robert Wood Johnson Foundation (RWJF), County Health Rankings, 2018. VA Plan for Well-Being Target = 20%
What Prevents You from Exercising, by TJHD Locality, 2018. Source: UVA Center for Survey Research and the Thomas Jefferson Health District, Community Health Survey, 2019.
Access to Exercise Opportunities, by TJHD Locality, 2014 & 2016. Source: Robert Wood Johnson Foundation (RWJF), County Health Rankings, 2018.
Food Insecurity, by TJHD Locality, 2013-2016. Source: Map the Meal Gap, Feeding America, 2018. VA Plan for Well-Being Target = 10%
Child Food Insecurity, by TJHD Locality, 2013-2016. Source: Map the Meal Gap, Feeding America, 2018. VA Plan for Well-Being Target = 10%
Poor Mental Health Days,by TJHD Locality, 2014-2016. Source: County Health Rankings, 2018.
Unable to Get Necessary Mental Healthcare, by TJHD Locality, 2018. Source: UVA Center for Survey Research and the Thomas Jefferson Health District, Community Health Survey, 2019.
Percent of Adults Smokers,by TJHD Locality, 2014-2016. Source: County Health Rankings, 2018.
Albemarle Overdose Mortality Rates(per 100,000 residents), TJHD and TJHD Localities, 2011-2017 & 2017. Source: Virginia Department of Health, Opioid Addiction Dashboard,2018 (http://www.vdh.virginia.gov/data/opioid-overdose). TJHD Overdose Mortality Rates, by TJHD Locality, 2017 Albemarle Overdose Mortality Rate, 2011-2017 Albemarle NAS Rate, 2011-2017
Charlottesville Overdose Mortality Rates(per 100,000 residents), TJHD and TJHD Localities, 2011-2017 & 2017. Source: Virginia Department of Health, Opioid Addiction Dashboard,2018 (http://www.vdh.virginia.gov/data/opioid-overdose). TJHD Overdose Mortality Rates, by TJHD Locality, 2017 Charlottesville Overdose Mortality Rate, 2011-2017 Charlottesville NAS Rate, 2011-2017
Albemarle Rate Summary by Age Groups,Rates per 100,000 Residents, 2017. Source: Virginia Department of Health, Opioid Addiction Dashboard, 2018(http://www.vdh.virginia.gov/data/opioid-overdose).
Charlottesville Rate Summary by Age Groups,Rates per 100,000 Residents, 2017. Source: Virginia Department of Health, Opioid Addiction Dashboard, 2018(http://www.vdh.virginia.gov/data/opioid-overdose).
Suicide Rate per 100,000 population, by TJHD Locality, 2010-2016. Source: Office of the Chief Medical Examiner, Virginia Department of Health, 2018.
Life Expectancy Estimates at Birthby TJHD Census Tract, 2008-2012. Source: Virginia Department of Health, Office of Vital Records, 2018 and U.S. Census Bureau, 2010 Population Counts, 2018.
Albemarle County Life Expectancy Estimates at Birthby TJHD Census Tract, 2008-2012. Source: Virginia Department of Health, Office of Vital Records, 2018 and U.S. Census Bureau, 2010 Population Counts, 2018. Hollymead & 29N Free Union, White Hall, Boonesville Advance Mills Earlysville Stony Point, Keswick, Cismont Branchlands, Fashion Sq, Rio Crozet Ivy, Ragged Mtn Reservoir Pantops & 250 Willow Heights, River Run, Dunlora Greenwood, Batesville Hydraulic/Rio and 29N (Turtle Creek, Townwood, Four Seasons, Commonwealth) Rivanna (Rt. 53 / 250) North Garden Monticello, Carters Mtn, Rt. 53 Barracks Road & outer Hydraulic/Rio Covesville, Esmont, Scottsville
CharlottesvilleLifeExpectancy Estimates at Birthby TJHD Census Tract, 2008-2012. Source: Virginia Department of Health, Office of Vital Records, 2018 and U.S. Census Bureau, 2010 Population Counts, 2018. The Meadows Greenbrier Barracks Road Barracks Rugby Rose Hill + 10th and Page Locust Grove Lewis Mtn North Downtown Martha Jefferson Jefferson Park Avenue Fifeville Woolen Mills Ridge Street Fry’s Spring Belmont
Percent of Families Below the Federal Poverty Level, Albemarle and Charlottesville, 2012-2016. Source: U.S. Census Bureau, American Community Survey 5-year Estimates, 2018. Percent of Families Below the Federal Poverty Level Map, Albemarle and Charlottesville, 2012-2016. Source: U.S. Census Bureau, American Community Survey 5-year Estimates, 2018.
ALICE Cost of Living Estimates Survival Budgets, 2016. (ALICE = Asset Limited, Income Restrained, Employed)Source: United Way, 2018 ALICE Report. Albemarle Survival Budget, 2016 Charlottesville Survival Budget, 2016
ALICE Cost of Living Estimates Survival Budgets, 2016. (ALICE = Asset Limited, Income Restrained, Employed)Source: United Way, 2018 ALICE Report. Albemarle Stability Budget, 2016 Charlottesville Stability Budget, 2016
ALICE Cost of Living Estimates, Charlottesville Households by Age and Race/Ethnicity, 2016. Source: United Way, 2018 ALICE Report.
ALICE Cost of Living Estimates, Albemarle Households by Age and Race/Ethnicity, 2016. Source: United Way, 2018 ALICE Report.
Percent Uninsured, by TJHD Locality, 2012-2016. Source: U.S. Census Bureau, American Community Survey 5-year Estimates, 2018.
Personal Doctor, TJHD Locality, 2018. Source: UVA Center for Survey Research and the Thomas Jefferson Health District, Community Health Survey, 2019.
In Past 12 Months Seen a Dentist for Cleaning, TJHD Locality, 2018. Source: UVA Center for Survey Research and the Thomas Jefferson Health District, Community Health Survey, 2019.
Albemarle and Charlottesville Low Birth Weight, by Race. 2008-2016. Source: Virginia Department of Health, Division of Health Statistics, 2018. Total Low Birth Weight Black Low Birth Weight White Low Birth Weight
Percent Free and Reduced School Lunch, Albemarle County and Charlottesville Public High Schools, 2008-2018. Source: Virginia Department of Education, 2018.
On-Time Graduation Rates,2008-2018 Class Year. Source: Virginia Department of Education, 2018.
On-Time Graduation Rates,2008-2018 Class Year. Source: Virginia Department of Education, 2018.
Questions? Guleer Shahab, Data Analyst Thomas Jefferson Health District 434-422-3214 guleer.shahab@vdh.virginia.gov 2019 MAPP2Health