Download

1 / 28
280 likes | 319 Views
Find out how LED offers detailed insights into workforce dynamics including turnover and earnings, and learn how to access LED data and tools for analysis.

E N D
Local Employment Dynamics Jeff Matson CURA, University of Minnesota Oriane Casale Labor Market Information Office, MN Dept. of Employment and Economic Development Francisca Winston Local Initiatives Support Corporation NNIP 5/15/09
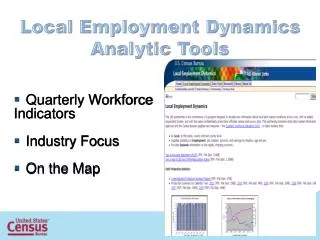
Outline • What is LED? • LED Data Products • How Do I Access LED Data? • LED Analysis
State LMI Offices U.S. Census Bureau U.S. Social Security Admin. DEED knows Where people work and how much $ they earn from working. Local Employment Dynamics Data LED Mapping Application State LMI Offices & Excensus LLC LED: Local Employment Dynamics The SSA knows where people live and their demographic attributes.
Role of LMI Office • States provide employer data - called QCEW - on a quarterly basis. • Minnesota provides tools to display and view data • M3D mapping tool for Origin-Destination and RAC and WAC files • LED County Reports tool from Census gives users access to MN Quarterly Workforce Indicators
LED Data Products • Quarterly Workforce Indicators (QWI) - data on workforce dynamics including turnover, new hires and separations by detailed geography, industry and demographics. • Origin-Destination – file linking where people live to where they work by Census block. • Workplace Area Characteristics / Resident Area Characteristics – Adds demographic and employment detail to O-D dataset.
Quality Workforce Indicators • Average earnings • Number of new hires and separations • Job flows – how many people are moving into and out of jobs during a quarter • Turnover • All by • Detailed industry • Age category • Gender • County of employment
Origin-Destination • Home block ID • Work block ID • Age • <31,31-64, >64 • Earnings • <$14,400, $14,400-$40,800, >$40,800 • Jobs • All jobs • Primary jobs • Private jobs • Private primary jobs • Industry – 3 broad categories
Workplace and Resident Area Characteristics • Age • Same as OD • Earnings • Same as OD • Industry of Occupation • 20 NAICS categories (2-digit)
Benefits of LEHD Data • Updated frequently • O-D updated annually • QWI updated quarterly • Population data, not sample or survey data • Geographic detail - data available at block level • Some demographic data available • Wage • Age • Industry of employment • Gender
Limitations to LEHD Data • Latest available O-D data is 2006 • Only includes jobs covered by Unemployment Insurance Program (~90-95% of jobs nationwide) • Only accurate to the extent that the underlying data are accurate • Demographic data presented in broad categories • Census does “fuzzing” of data to protect business/worker identity
Where to Get LED Data • Cornell Virtual Research Data Center • Web GIS Sites • OnTheMap • Minnesota 3D • Open Source (MapServer, Chameleon, PostGIS)
Cornell Virtual Research Data Center www.vrdc.cornell.edu/onthemap/data
File types • Data from 2002-2006 • Main & Aux files • All Jobs, Primary Jobs, Private Jobs, Private Primary Jobs • Wage, Age, Industry breakdowns (WAC/RAC only) • 40 O-D files, 200 RAC/WAC files for each state • Compressed size of entire U.S. file set is 19GB • gzip’d comma-separated text files (.csv.gz)
OnTheMap • Place-based search • Graphical or Text-based Interface • Map & Report Generation in a variety of formats, levels of geography, permutations of data • Covers entire U.S.* * - States Participating in LED
Minnesota 3D • Minnesota Based LED Data • 90+ Additional Layers • Services / Resources, External Links • Unique Datasets • Metro Foreclosures (point) • Sales Tax Revenue (block group) • Affordable Housing Inventory (point) • MN State Tax Returns (block group)
M3D Websitehttp://map.deed.state.mn.us/M3D(Google: M3D) On The Map http://lehdmap3.did.census.gov/themap3/ (Google: Census LED, OnTheMap)