Download
1 / 23
230 likes | 302 Views
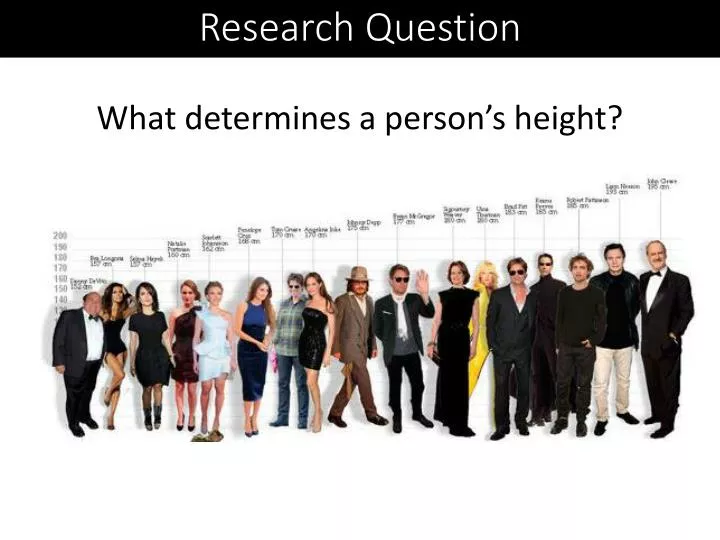
This research delves into the factors influencing a person's height. Hypotheses explore genetics, nutrition, and immigration origins, while literature reviews suggest relationships between parental height and offspring height. Analysis reveals the impact of variables such as genes, early life, illnesses, and socioeconomic statuses. Linear regression models and correlation matrices are utilized to investigate these influences. Key findings highlight gender as a significant factor, with parents' height playing a lesser role. Recommendations for future research include analyzing contemporary datasets and location-specific studies.

E N D
Research Question What determines a person’s height?
Hypothesis Brainstorming • Genetics • Nutrition • Immigration / Origins • Disease Hypotheses: • Sons will be similar to their Dad’s height • Daughters will be similar to their Mom’s height
Literature Review: Article #1 Francis Galton • Invented Regression • When Mid-Parents are taller then mediocrity, their Children tend to be shorter than they • When Mid-Parents are shorter than mediocrity, their Children tend to be taller then they
Literature Review: Article #2 • Variables: • Genes • First two years of life • Illnesses • Infant mortality rates • Smaller Families • Higher income • Better education
Literature Review: Article #3 “we find that a 54-loci genomic profile explained 4–6% of the sex- and age-adjusted height variance” “the Galtonian mid-parental prediction method explained 40% of the sex- and age-adjusted height variance”
Variables Dependent Variable Y Y Height X4 X3 X1 X2 X’s Independent Variables
Height Dataset Variables heights <- read.csv("GaltonFamilies.csv")
Dataset Variables: Type Data Types: Numbers and Factors/Categorical
Frequency Distribution, Histogram hist(heights$childHeight)
Mode, Bimodal hist(h$childHeight,freq=F, breaks =25, ylim = c(0,0.14)) curve(dnorm(x, mean=mean(h$childHeight), sd=sd(h$childHeight)), col="red", add=T) Bimodal: two modes
Correlation Matrix for Continuous Variables PerformanceAnalytics package chart.Correlation(num2)
Correlations Matrix: Both Types Zoom in on Gender library(car) scatterplotMatrix(heights)
Categorical: Revisit Box Plot Correlation will depend on spread of distributions Note there is an equation here: Y = mx b
Linear Regression: Model 1 Child’s Height = f(Father’s Height)
Linear Regression: Model 2 Child’s Height = f(Father’s Height) model.5 <- lm(childHeight~gender, data = h)
Linear Regression: Additional Models • Mom • MidParent Height
Discussion Summary • Key Findings: • Gender was the biggest factor • Parents height played a lesser role • Downsides • DataSet used did not include more variables of interest • DataSet for X Country for 1877
Future Research • Include More Predictor Variables • Literature review of a few articles suggests several important factors: • Nutrition • Analyze a Contemporary DataSet • DataSet used was from 18?? • Location Specific as Well