Download
1 / 9
90 likes | 232 Views
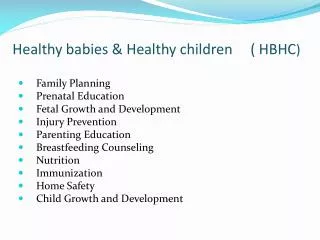
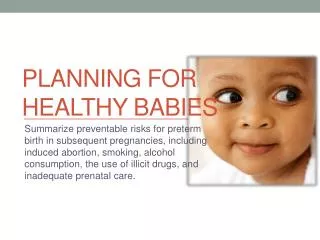
Healthy Babies in Healthy Families Health Update. Karen Remley, MD, MBA, FAAP Commissioner, Virginia Department of Health November 2011. Setting the Stage in Virginia. 1.6 Million Women of Childbearing Age. 135,464 Pregnancies. 102,934 Live Births. 24,892 Induced Terminations.

E N D
Healthy Babies in Healthy Families Health Update Karen Remley, MD, MBA, FAAP Commissioner, Virginia Department of Health November 2011
Setting the Stage in Virginia 1.6 Million Women of Childbearing Age 135,464 Pregnancies 102,934 Live Births 24,892 Induced Terminations 10,389 Pre-Term Births 6,590 Spontaneous Terminations Source: VDH Division of Health Statistics Resident Live Birth, Death, Fetal Death and Induced Termination of Pregnancy Certificates 2010.
Virginia State Resident Profile of Maternal and Child Health Source: VDH, Division of Health Statistics Resident Live Birth, Death , Fetal Death, and Induced Termination of Pregnancy Certificates 2009-2010, compiled by the Policy & Assessment Unit, Office of Family Health Services. The most recent population data (2009) was used for denominators. 1VDH Division of Immunization.
The rate of pregnancies to teens ages 15-19 years declined by 46% from 1995 to 2010 in Virginia Source: VDH Division of Health Statistics Resident Live Birth, Death , Fetal Death, and Induced Termination of Pregnancy Certificates 1995-2010, compiled by the Policy & Assessment Unit, Office of Family Health Services. The most recent population data (2009) was used for denominators. U.S. data: Kost K, Henshaw S and Carlin L, U.S. Teenage Pregnancies, Births and Abortions: National and State Trends and Trends by Race and Ethnicity, 2010.
Virginia’s Late Preterm Birth Rate is Declining The rate of late preterm births declined by 9% from 2005 to 2010 Source: Virginia Department of Health, Division of Health Statistics, compiled by the Office of Family Health Services, Division of Child and Family Health, 2005-2010
Source: VDH Division of Health Statistics Resident Live and Death Certificates 1998-2010, compiled by the Policy & Assessment Unit, Office of Family Health Services National Center for Health Statistics, 1998-2008.
< 12 years 12 years >12 years non-Hispanic Black Hispanic non-Hispanic White < 20 20-24 25-29 30+ <$20,000 $20,000-$49,999 >$50,000 Percent of infants brought home in a car seat, 2008-2009 Virginia PRAMS Source: Virginia Department of Health, Pregnancy Risk Assessment Monitoring System, 2008-09.
< 12 years 12 years >12 years non-Hispanic Black Hispanic non-Hispanic White < 20 20-24 25-29 30+ <$20,000 $20,000-$49,999 >$50,000 Percent of infants laid to sleep on their back, 2008-2009 Virginia PRAMS Source: Virginia Department of Health, Pregnancy Risk Assessment Monitoring System, 2008-09.