Download
1 / 16
160 likes | 340 Views
Mapping Afghanistan Irrigated Areas with MODIS NDVI. Michael Budde , Md. Shahriar Pervez, James Rowland US Geological Survey – EROS. Methodology. 4-step Process Step 1 Classify grassland/rangeland Classify forest Terrain characterization Step 2 Build a mask using step 1 outputs

E N D
Mapping Afghanistan Irrigated Areas with MODIS NDVI Michael Budde, Md. Shahriar Pervez, James Rowland US Geological Survey – EROS
Methodology • 4-step Process • Step 1 • Classify grassland/rangeland • Classify forest • Terrain characterization • Step 2 • Build a mask using step 1 outputs • Identify potential agricultural areas by applying the mask • Step 3 • Develop rules for the decision tree model • Step 4 • Evaluation
Identify spectral signatures for grassland/forest classes Grassland Forest
+ + = Develop and apply non-agriculture mask Grassland Forest Slope > 20 % Potential Agricultural Land – Peak NDVI (21 Mar – 24 May)
Mask compared to 1993 land cover – upper Helmand 1993 land cover overlaid on 2000 - 1stseason peak NDVI
Develop decision tree rules • Peak NDVI of the following time periods • FS = 1st season : Period 6 to 10 (Mar 21 – May 24) • SS = 2nd season : Period 14 to 18 (Jul 27 – Oct 15) • MS = Middle : Period 11 to 13 (Jun 9 – Jul 11) • TIN= Time Integrated NDVI : Period 7 to 16 (Apr 6 to Aug 28) 1st season 2nd season FS & SS > MS MS < FS > 0.35 1700 > TIN > 1300 FS & SS > MS + 5% 1700 > TIN > 1300 TIN Decision Tree Bi-modal Irrigated 1st Season Irrigated MS < SS > 0.35 1700 > TIN > 1300 N Y 2nd Season Irrigated N Y Y • Thresholds are set by comparison with base year of 2004 Google Earth imagery Y
Results comparing 2000 vs 2011 – increased irrigation 2000 : Irrigated Area 2011 : Irrigated Area
Visual comparisons with Landsat Irrigated Area From MODIS: 2000 False color Landsat 5: Mar 21, 2000
Visual comparisons with Landsat Irrigated Area From MODIS : 2010 False color Landsat 5: Apr 1, 2010
Irrigated areas from Landsat False color Landsat 5: Apr 1, 2010 NDVI > 0.45 and K < 311 • DN to Reflectance to NDVI • DN to Kelvin (thermal band) • Only in areas with at least 3 scenes available between March and August • Irrigated: IF criteria met in any one of three Landsat scenes between Mar & Aug
Area comparison Limited to areas with Landsat scenes for both seasons • MODIS at 250m • Landsat at 30m • 18 polygons – delineate irrigated areas from both image sources • Total irrigated area extracted at each polygon
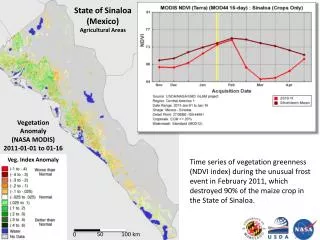
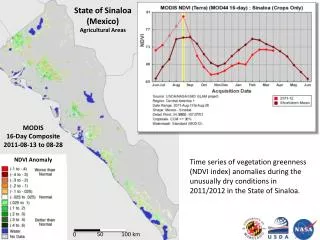
Time evolution of irrigated areas Cereals include Wheat, Milled Rice, Maize and Barley – FAO 2011 Report