Download
1 / 27
270 likes | 431 Views
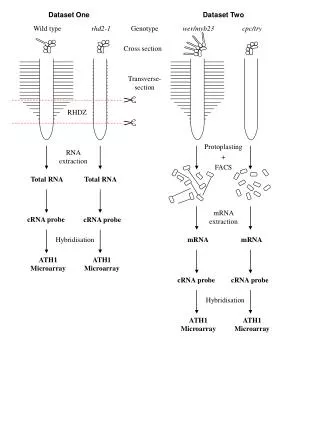
The EN dataset. Simon Good and Claire Bartholomew. What is the EN dataset?. Climate dataset of temperature and salinity profiles Data quality controlled using a suite of automatic checks Monthly objective analyses are created from the data (and used in quality control)

E N D
The EN dataset Simon Good and Claire Bartholomew
What is the EN dataset? • Climate dataset of temperature and salinity profiles • Data quality controlled using a suite of automatic checks • Monthly objective analyses are created from the data (and used in quality control) • EN name has origins in European projects that funded initial versions • Current publicly available version of the EN dataset is EN3 (v2a) (see www.metoffice.gov.uk/hadobs/en3) • A new version is being prepared (EN4; Good et al. 2013 submitted) • In this presentation I am mostly information the new version (EN4)
The EN dataset Table of Contents • Data sources • Quality control procedures • Data format and dissemination • Data users • Performance of quality control
Data sources • We use data from • World Ocean Database 2009 (WOD09) • Global Temperature-Salinity Profile Program (GTSPP) • Argo • Arctic Synoptic Basinwide Observations project • Main data source is WOD09 • Monthly updates performed using data from GTSPP and Argo • Data from any profiling instrument are used
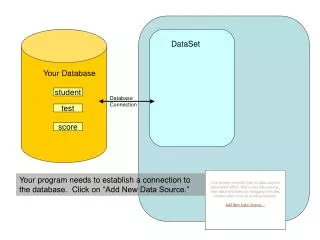
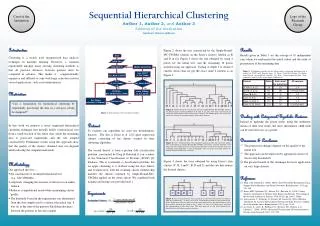
How the dataset is made Observations Quality control Output as NetCDF file Available from Met Office website Persistence forecast One month of observations processed per cycle Output as NetCDF file Analysis
Quality control • Incorporates a duplicate check adapted from the Gronell and Wijffels (2008) • Profiles with >400 levels are subsampled • Quality control is of both temperature and salinity and is mostly automatic • Exceptions are exclusion lists obtained externally and a list of manual rejections developed for a previous version of data • EN system shares a code base with ocean forecasting system requiring real time quality control, hence good automatic methods are required • Currently do not have any effort given to manual quality control of subsurface data
Quality control Automatic quality checks External quality information Profile check (spikes etc.) Thinning (informational) Argo grey list Track check Background checks Argo delayed mode flags Manual exclusions Buddy check Multi level check Argo altimetry quality control Bathymetry check Stability check Near surface and deep BTs Measurement depths check Waterfall check
Track check Spike check Background check
Quality control code • Written in Fortran • Owing to way the data are processed and stored, can require a lot of memory if there are a lot of profiles and/or levels • Number of levels are thinned to 400 if profile has more • A month of data requires between a few seconds to ~25 minutes to run (depending on data quantity) on a desktop machine
Data availability and use • Each month of data is added around the middle of the following month • Data are provided on Met Office website (current version at www.metoffice.gov.uk/hadobs/en3) • Uses are varied • Gridded products • Monitoring ocean conditions • Time series of ocean heat content • Initialising seasonal/decadal predictions • Ocean reanalysis • Comparisons to climate model data
Comparison between results from the EN system and the QuOTA dataset
Comparison between QuOTA and EN processing • For profiles with between 2 and 400 temperature levels • Results are preliminary – we are still working on understanding the quality control flags and the impact that the differences have • We count the number of profiles with any levels rejected • Level by level comparison is difficult • EN system = automated system • CSIRO system = semi-automated system
For profiles with AutoQC >0 (i.e. flagged up in semi-automated system and so have gone through the Mquest QC – 268550 of these such profiles): MethodComparison Majority of ‘good profiles failed’ are due to bad fill values in profiles – so are actually correct rejects by the automated system All profiles across Indian Ocean and Tasman Sea (582486 in total) 1942-2005
Proportion of failed levels • For all profiles that have one or more temperature level rejected, the average proportion of levels rejected per profile is: • for automated (MO) system: 0.025 • for semi-automated (CSIRO) system: 0.169 • However, when looking over all profiles, the difference between the two systems is less significant: • for automated (MO) system: 0.0056 • for semi-automated (CSIRO) system: 0.0065 (as semi-automated system has more profiles with all levels passed, and so help to lower the average when looking at all profiles.) This analysis is done over 4 months of all profiles (not just ones with AutoQC > 0).
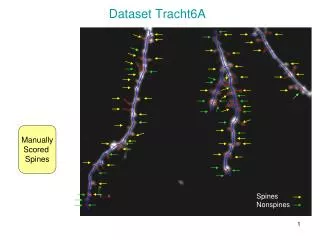
‘Typical’ profiles missed by EN system but rejected by CSIRO system: Act codes: TO(2) TZ(2) Act codes: TO(2) TV(2) Act codes: TO(3)
15 0, 1, 2 15 15 ‘Typical’ profiles rejected by EN system but not by CSIRO system:
CSIRO – Temperature offset flag – erroneous temp compared to climatology/neighbouring profiles – full profile rejected EN - Rejected by Bayesian and buddy checks EN - Rejected by Bayesian and buddy checks and temperature being out of a reasonable range CSIRO – Wire break flag CSIRO – Gradient spike Temperature offset flag EN - Rejected by Bayesian and buddy checks Typical profiles caught and rejected by both systems
Impact on applications (only had a quick look so far) • Localised differences can be fairly large • Area average differences tend to be small
Bit codes • Levels: • 0 – Temperature reject • 2 – Vertical stability • 3 – Increasing depth • 8 – BT shallow or deep obs reject • 10 – Temperature out of range • 12 – Vertical check • 13 – No background • 14 – Background check on observed levels • 15 – Background/buddy • 16 – Level reinstated after background reject • Profiles: • 0 – Temperature reject • 2 – Thinning flag (not a reject) • 3 – Track check • 4 – Vertical stability • 6 – Bathymetry reject • 11 – Vertical check • 12 – No background • 13 – 50% levels rejected
QC decisions for profiles rejected by the CSIRO system but missed by EN system: Just selecting QC flags with associated flag severity of 3 or 4. • BO – Bowing problem or bowed mixed layer • CL – Contact Lost (probe records before entering water) • CS – Surface spike • CT – Constant temperature, hit bottom • DD – Statistical screening flag • DO – • DP - Duplicate drop or depth corrected • DT - • DU – Duplicate drop • GL – Gradient long (inversion) • GS – Gradient short (spike) • HB – Hit Bottom • IP – Input record • LE – Leakage • M1/2 – Statistical screening flag • NG – No good trace • NT – No trace • PE – Position error • SO – Surface offset (stats screening) • SP – Spike • TO – Temperature offset • UR – Under resolved • WB – Wire break
QC decisions for profiles rejected by the EN system but passed by CSIRO system: • Bit codes: • 2 – Thinning flag (not a reject flag) • 3 – Track check reject • 4 – Profile vertical stability reject • 6 – Bathymetry reject • 11 – Temperature level rejected because on EN3 reject list • 12 - Temperature level rejected due to vertical check (spikes etc.) • 13 – Temperature level rejected because no background value available • 14 - Temperature level rejected due to Bayesian background check • 15 - Temperature level rejected due to Bayesian and buddy checks • 16 – Temperature level reinstated after rejection by the Bayesian and buddy checks • (Removed 0, 8 and 10 from plots)
QC decisions for ‘bad’ profiles caught in both systems Flag severity 3 or 4 All flag severities