Download
1 / 23
230 likes | 357 Views
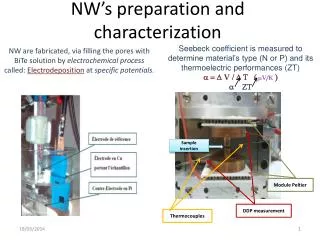
Memory S ystem C haracterization of Big Data W orkloads. Martin Dimitrov, Karthik Kumar , Patrick Lu, Vish Viswanathan, Thomas Willhalm. Agenda. Why big data memory characterization? Workloads, Methodology and Metrics Measurements and results Conclusion and outlook.

E N D
Memory System Characterization of Big Data Workloads Martin Dimitrov, Karthik Kumar, Patrick Lu, Vish Viswanathan, Thomas Willhalm
Agenda • Why big data memory characterization? • Workloads, Methodology and Metrics • Measurements and results • Conclusion and outlook
Why big data memory characterization? • Studies show exponential data growth to come. • Big Data: information from unstructured data • Primary technologies are Hadoop and NoSQL
Why big data memory characterization? Power Memory consumes upto 40% of total server power • Large data volumes can put pressure on the memory subsystem • Optimizations tradeoff CPU cycles to reduce load on memory, ex: compression Performance Memory latency, capacity, bandwidth are important Important to understand memory usages of big data
Why big data memory characterization? • Focus on • latency hiding optimizations • Emerging memories have higher latency DRAM scaling is hitting limits How do latency-hiding optimizations apply to big data workloads?
Executive Summary • Provide insight into memory access characteristics of big data applications • Examine implications on prefetchability, compressibility, cacheability • Understand impact on memory architectures for big data usage models
Agenda • Why big data memory characterization? • Workloads, Methodology and Metrics • Measurements and results • Conclusion and outlook
Big Data workloads • Sort • WordCount • Hive Join • Hive Aggregation • NoSQL indexing • We analyze these workloads using hardware DIMM traces, performance counter monitoring, and performance measurements
General Characterization • Memory footprint from DIMM trace • Memory in GB touched atleast once by the application • Amount of memory to keep the workload „in memory“ • EMON: • CPI • Cache behavior: L1, L2, LLC MPI • Instruction and Data TLB MPI Understand how the workloads use memory
Cache Line Working Set Characterization • For each cache line, compute number of times it is referenced • Sort cache lines by their number of references • Select a footprint size, say X MB • What fraction of total references is contained in X MB of the hottest cache lines? Identifies the hot working set of application
Cache Simulation • Run workload through a LRU cache simulator and vary the cache size • Considers temporal nature, not only spatial • Streaming through regions larger than cache size • Eviction and replacement policies impact cacheability • Focus on smaller sub-regions Hit rates indicate potential for cacheability in tiered memory architecture
Entropy • Compressibility and Predictability important • Signal with high information content – harder to compress and difficult to predict • Entropy helps understand this behavior. For a set of cache lines K: Lower entropy more compressibility, predictability
Entropy - example (A) (C) (B) Footprint: 640B Footprint: 640B Footprint: 640B References: 100 References: 100 References: 100 References/line: 10 References/line: 10 References/line: 10 64 byte cache: 10% 64 byte cache: 19% 64 byte cache: 91% < < 192 byte cache: 30% 192 byte cache: 57% 192 byte cache: 93% Entropy: 0.217 Lower entropy more compressibility, predictability Entropy: 0.785 Entropy: 1
Correlation and Trend Analysis Examine trace for trends Eg: increasing trend in upper physical address ranges Aggressively prefetch to an upper cache • With s = 64, l=1000, test function f mimics ascending stride through memory of 1000 cache lines • Negative correlation with f indicates decreasing trend High correlation strong trend predict, prefetch
Agenda • Why big data memory characterization? • Big Data Workloads • Methodology and Metrics • Measurements and results • Conclusion and outlook
General Characterization • NoSQL and sort have highest footprints • Hadoop Compression reduces footprints and improves execution time
General Characterization • Sort has highest cache miss rates (transform large volume from one representation to another) • Compression helps reduce LLC misses
General Characterization • Workloads have high peak bandwidths • Sort has ~10x larger footprint than wordcount, but lower DTLB MPKI: memory references not well contained within page granularities, and are widespread
Cache Line Working Set Characterization NoSQL has most spread among its cache lines Sort has 60% references in 120GB footprint within 1GB Hottest 100MB contains 20% of all references
Cache Simulation • Percentage cache hits higher than percentage references from footprint analysis Big Data workloads operate on smaller memory regions at a time
Entropy from [Shao et al 2013] Big Data workloads have higher entropy (>13) than SPEC workloads (>7) they are less compressible, predictable
Normalized Correlation • Hive aggregation has high correlation magnitudes (+,-) • Enabling prefetchers has higher correlation in general Potential for effective prediction and prefetching schemes for workloads like Hive aggregation
Take Aways & Next Steps • Big Data workloads are memory intensive • Potential for latency hiding techniques like cacheability and predictability to be successful • Large 4th level cache can benefit big data workloads • Future work • Including more workloads in the study • Scaling dataset sizes, etc