Download
1 / 34
440 likes | 830 Views
Psychological Research Methods & Statistics. Excavating Human Behaviors. Psychology & Research Methods. A “Scientific Attitude” is critical… Curiosity – a passion to explore and understand.

E N D
Psychological Research Methods & Statistics Excavating Human Behaviors
Psychology & Research Methods A “Scientific Attitude” is critical… • Curiosity – a passion to explore and understand. • Skepticism – psychologists, like other scientists, approach the world of behavior with curious doubt. They are constantly asking two questions: What does it mean? How do you know? • Humility – an awareness and acceptance that we may have to reject our own ideas or theories (if they are proven wrong). • Critical Thinking – a scientific approach prepares/demands us to think “smarter” to examine assumptions, evaluate evidence, and assess conclusions.
The tendency to believe, after learning the outcome, that you knew it all along. With 20/20 hindsight, everything seems obvious. Hindsight Bias
Overconfidence • We tend to think we know more than we do. • We tend to be more confident than correct! 82% of U.S. drivers consider themselves to be in the top 30% of their group in terms of safety 81% of new business owners felt they had an excellent chance of their businesses succeeding. When asked about the success of their peers, the answer was only 39%. (Now that's overconfidence!!!)
Exercise: Unscramble these Anagrams • WREAT • ETRYN • GRABE
Anagram Solutions • WREAT --- WATER • ETRYN --- ENTRY • GRABE --- BARGE
Psychological Research Methods • Psychology is an experimental science. • Assumptions must be supported by evidence. • Psychologists use a variety of research methods to study behavior and mental processes. • Psychologists follow the same general procedure when conducting research: • Asking research questions • Forming hypothesis (hypotheses) • Testing the hypotheses • Analyzing the data (results) • And drawing conclusions • Eventually, replicating research
The Scientific Method • Step 1: Forming research questions – • Beginning with scientific curiosity and interest, many research questions come from daily experience, psychological theory, or common knowledge. • Step 2: Forming hypotheses – • An hypothesis is a statement of that which you wish to prove. • An hypothesis is a predicted “answer” to the question (or in the words of some researchers, “an educated guess”).
The Scientific Method • Step 3: Testing hypotheses – • Once a hypothesis has been formed, it must be scientifically tested and proved right or wrong. • This part of conducting research is the “actual” experiment. • Psychologists use a variety of methods to test hypotheses. • Step 4: Analyzing Results – • Data is analyzed using statistics. • The more data collected, the more complex a task it is to analyze.
The Scientific Method • Step 5: Drawing Conclusions – • Once the results have been analyzed, a psychologist can draw or make conclusions about his/her questions and hypotheses. • Step 6: Replication – • Even when a research study carefully follows proper procedures, its findings might just represent a random occurrence. • To confirm the results and conclusions of a research study, the study must be replicated. • The study must be repeated and it must produce the same or similar results as before. • If there are different results, then the findings of the first study are questioned.
Selecting Subjects • Population – all members of a given group (within the study). • Sample – a subset of the population which is representative of the whole population. • Random Sample – a sample in which every member of the population has an equal chance of being selected. • Stratified Sample – a sample in which each subgroup of the population is represented proportionally to its size in the population.
Key Research Terminology • Using a random sample that represents the whole population, a researcher can generalize findings to the entire population. • CAUTION: Overgeneralization – is the making of generalizations using unrepresentative cases. It is easy to do but typically erroneous. • False Consensus Effect: the tendency to overestimate the extent to which others share our beliefs and behaviors
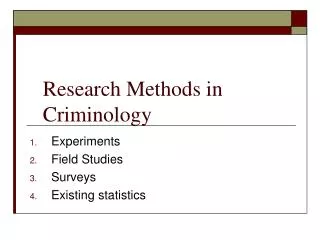
Methods of Collecting Data • Survey – commonly used in both descriptive and correlational studies, questionnaire method sampling many cases (individuals) in less depth • Case Study – the study of one or more individuals in great depth, to inform about an entire population or sample • Testing – psychological tests are given to measure certain mental processes, such as intelligence, aptitude, or personality
The Survey Method • Used in both descriptional and correlational research. • Use Interview, mail, phone, internet etc… • The Good- cheap, anonymous, diverse population, and easy to get random sampling (a sampling that represents your population you want to study)
Survey Method: The Bad • Low Response Rate • People Lie or just misinterpret themselves. • Wording Effects How accurate would a survey be about the frequency of diarrhea?
Naturalistic Observation • Observing and recording behaviors of an organism in natural environment • No control- just an observer • This method does not explain behavior but describes it What are the benefits and detriments of Naturalistic Observation?
Methods of Collecting Data • Laboratory Observation – this research method involves watching and recording behaviors of organisms NOT in their natural environment BUT in a laboratory setting. Cross-sectional Studies – uses participants (subjects) of different ages to compare how certain variables may change over the life span. Longitudinal Studies – use one group of participants over a long period of time. This method of study tracks the change over time of the participants.
Correlational Research • Detects relationships between variables • Does NOT say that one variable causes another There is a positive correlation between ice cream and murder rates. Does that mean that ice cream causes murder?
Correlation vs.Cause & Effect • Correlation coefficient is a statistical measure of relationship (it reveals how closely related two factors are or how closely two factors vary together and thus how well either one predicts the other). • Positiveand negative correlations are possible • A relationship does not mean causation!!! • For example, watching TV violence positively correlates with aggressive behavior; but does not necessarily mean watching violence on TV causes aggressive behavior.
Experimental Research • Explores cause and effect relationships Constipation Eating too many bananas causes
Experimental Research • In an experiment, participants receive what is called a treatment, such as a change in room temperature or a new drug. • Then, psychologists carefully observe the participants to determine how the treatment influences their behavior.
Independent and Dependent Variables • All research studies measure and observe variables (factors), especially experimental studies. • In an experiment, the independent variable is the factor that the researcher manipulates (controls) so that they can determine its effect on the dependent variable. • The dependent variable is the factor that depends on the manipulated independent variable(s).
Experimental and Control Groups • The experimental group is a group of participants who receive the treatment or manipulated variable. • The control group is a group of participants who do not receive the manipulated variable (instead a placebo of sorts). • All other variables/factors are held constant (or equal) for both groups (to try to isolate a cause and effect relationship between independent variable(s) of interest to the research psychologist and the dependent variable. • If the research psychologist fails to manage the ‘other’ variables (or hold them constant), they become confoundingvariables. Confounding variables are baaaaad!!!
Experimental Methodcontinued • Psychologists randomly place participants (subjects) into one group or another. • EXAMPLE: The effect of extracurricular activities on student’s academic success. • Once subjects are randomly placed into the control and experimental groups, the researcher makes sure that all other variables are the same for all students regardless of group. • Using this grouping method in the experimental method is called a controlled experiment. The Placebo Effect • In research studies and in our daily lives, our expectations affect what happens to us. • Feeling better simply because we expect to feel better and for no other reason is an example of the placebo effect. • A placebo is a substance or treatment that has no effect apart from the person’s belief in it.
Experimental Methodcontinued Single-blind vs. Double-blind Studies • In a single-blind study, participants do not know whether they are receiving the treatment (the manipulated independent variable) or not. In other words, they do not know if they are in the experimental group or in the control group. • This process avoids the placebo effect. • In a double-blind study, both participants and researchers are unaware of who has placed in which group.
Statistics & Research Methods • Describing (Quantifying) Data • Scaling – assigning numbers to observed events (responses, etc.) • Categorical Scale (Nominal) – a number/score is assigned to individuals so as to group responses into categories (example: gender) • Ordinal Scale – assigning numbers to convey relative meaning among responses (example: making a list from “most” to “least” • Interval Scale – assigning numbers/scores in which equal differences can be treated as equal units (example: reaction time) • Ratio Scale – relative scores assigned by way of multiples and includes a true zero point (example: 15 is 3 times greater than 5)
Statistics & Research Methods • Frequency Distribution – a set of data that tells you how many… Descriptive Statistics Measures of Central Tendency • Mark the center of a distribution Mean, Median, Mode • Mean – is average of all the scores in a distribution • Median – is the central score in a distribution • Mode – is the score that appears most frequently • The mean is the most commonly used measure of central tendency, but its accuracy can be distorted by extreme scores or outliers. Measures of Variability • Range – is the distance between the highest and lowest scores in a distribution. • Variance – is the amount of difference/variability between scores in a distribution. • Standard deviation – is simply the square root of the variance (Both variance and standard deviation relate the average distance of any score in the distribution from the mean). • Z-scores – measure the distance of a score from the mean in units of standard deviation (to compare scores from different distributions). • Normal Distribution or Normal Curve or Bell-shaped Curve – approx. 68% of scores in a normal distribution fall within one standard deviation of the mean and approx. 95% of scores fall within two standard deviation of the mean.
Statistics & Research Methods Inferential Statistics • While descriptive statistics provide a way to summarize information about a sample studied, the purpose of inferential statistics is to determine whether or not findings can be applied to the larger population from which the sample was selected. • The extent to which the sample differs from the population is known as sampling error. • A few inferential statistical tests exist such as t-tests, ANOVAs, and MANOVAs. • These tests take into account both the magnitude of the difference found and the size of the sample. • All these tests yield a p value. The smaller the p value, the more significant the results. • P value of .05 is the cutoff for statistically significant results. (p value of .05 means that a 5% chance exists that the results occurred by chance. • P value of .01 is sometimes sought for greater certainty of significant results. • P value can never equal 0 because one can never be 100% certain that results did not happen randomly by chance. • Replication allows for greater certainty of results.
Statistics & Research Methods • Null hypothesis: (H0) is a hypothesis (scenario) set up to be nullified, refuted, or rejected ('disproved' statistically) in order to support an alternative hypothesis • Type I error: the error of rejecting a null hypothesis when it is actually true • Type II error: the error of failing to reject a null hypothesis when the alternative hypothesis is the true state of nature
T-test • The t-test assesses whether the means of two groups are statistically different from each other. This analysis is appropriate whenever you want to compare the means of two groups • www.graphpad.com/quickcalcs/ttest1.cfm X = mean of group Var = Standard deviation of group N = number in sample
Research & Statistics Assignment 1 • Gather shoe size data from 10 females and 10 males, recording the shoe size of each. • Then calculate the measures of central tendency (mean, mode, median) and graph the data set in a frequency histogram and box-plot. • Find and discuss any outliers • Explain the gender difference, if one exists.
Research & Statistics Assignment 2 • Using the Research Question: How many pairs of shoes do males and females own? Write a testable hypothesis. • Next, gather data from 10 females and 10 males, recording the number of shoes owned by each. • Ask your participants, “How many pairs of shoes do you own?” and (obviously) record their answer and gender. • Calculate the measures of central tendency and standard deviation and test for differences between means using a t-test. (use www.graphpad.com/quickcalcs/ttest1.cfmto help you calculate a t-score) • Write a brief conclusion about your results (at least 1 paragraph). Make sure you give an explanation for the differences between the gender.