Download
1 / 31
340 likes | 584 Views
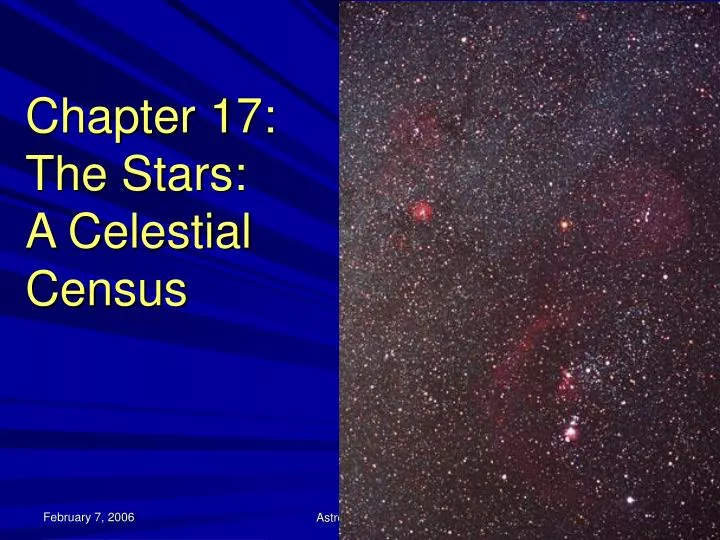
Chapter 17: The Stars: A Celestial Census. The Lives of Stars. Stars live for a very long time, 100 million years and up. We can’t possibly observe a star this long! How can we learn about the stages in a star’s life?

E N D
Chapter 17: The Stars:A Celestial Census Astronomy 2010
The Lives of Stars • Stars live for a very long time, 100 million years and up. • We can’t possibly observe a star this long! • How can we learn about the stages in a star’s life? • We perform a census, getting a snapshot of many stars at different stages of their life. • We infer the stages a star goes through from the data we assemble in the census. • Cuidado! We can be misled if the star sample in the census is biased. (Like political surveys.) Astronomy 2010
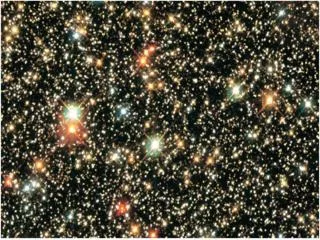
A Stellar Census • We measure distances in light years (LY). • More details in Ch. 18 • Small stars are less luminous, and therefore harder to see. • If not corrected for, we will have a biased sample of stars. • Careful observation reveals that small stars (brown dwarfs) are more common than large stars. • While less numerous, large stars are easier to see at large distances. Most of the stars visible to the naked eye are large. Astronomy 2010
All Stars are Different • colors: blue-white to red • brightness: bright to very faint • Orion: Constellation with many different star types • Betelgeuse: orange-red supergiant • Rigel: blue-white supergiant Astronomy 2010
Key Properties of Stars color = surface temperature Rigel (blue) 10,000 K Sun (yellow) 6000 K Betelgeuse (orange-red) 3,000 K spectrum = chemical composition Rigel B Sun G Betelgeuse M luminosity Rigel 60,000 LSun Betelgeuse 50,000 LSun mass Rigel 16 solar masses Betelgeuse 20 MSun diameter Rigel 7 solar diameters Betelgeuse 1000 DSun Astronomy 2010
17.2 Measuring Stellar Masses • Mass is one the key parameters of stars • Determines the behavior and life cycle of the star • Determined for binary stars – most common case: spectroscopic binary stars orbit depends on mass of two stars Astronomy 2010
Orbit of Binary Stars Masses center of mass D • Kepler's third law: (modified) • orbital period P and semimajor axis D of ellipse related to masses M1 and M2 • D3 = (M1+M2)P2 • D in AU, P in years, M1 and M2 in solar masses (Msun) • each star orbits a common point – the center of mass • Star’s distance from center of mass determines the star’s individual mass. Astronomy 2010
Visual Binaries: Wobbling Motion Astronomy 2010
Sirius A and B • Sirius A normal star (class A main sequence) • Sirius B white dwarf companion • orbits are drawn to scale • exaggerated sizes of the two stars • Sirius A is considerably larger than the Sun while the white dwarf Sirius B is about the size of the Earth. Astronomy 2010
Spectroscopic Binary Stars most known binaries are spectroscopic binaries distance too great to resolve the two stars individually binary nature is indicated in the periodic shift of their spectral lines as they orbit around each other can measure their speeds from the Doppler shifted lines speed determines the mass Astronomy 2010
17.2.3The Range of Stellar Masses • How large and small can stars be? • Stars with 100 solar masses are known, and we believe there may be stars up to about 200 solar masses (200 Msun). • True stars must be heavier than 1/12 Msun. • Objects between 1/100 Msun and 1/12 Msun may produce energy by fusion for a short time and are called brown dwarfs. • Objects less than 1/100 Msun are planets. Astronomy 2010
17.2.4 The Mass-Luminosity Relation • As shown in Fig. 17.8, there is a correlation between mass and luminosity. • More massive stars are more luminous (give off more energy). • For a few stars this relation is violated. These exceptions are the white dwarfs. Astronomy 2010
Mass vs. Luminosity each point on this plot represents the absolute magnitude (luminosity) and color (temperature) of a main sequence star • Sun: • luminosity 1.0 • mass 1.0
17.3 Diameters of Stars • Moon crosses in front of star – eclipse • brightness of the star decreases gradually during the eclipse • time for decrease depends on size of star • Eclipsing binary stars Brightness Time Astronomy 2010
Eclipsing Binary System • Stars orbiting each other in a plane parallel to the line of sight: • orbit is seen edge-on. • One star periodically eclipses the other: • total brightness of the combined stars decreases during the eclipse. • The reduction in brightness depends on the luminosity and relative size of the two stars. Astronomy 2010
Interferometry • Combine the light from two or more telescopes in a special way that yields the resolution of a much larger telescope. • Regularly done with radio waves, very difficult to do with light. Astronomy 2010
H-R Diagram • Relationship between temperature (color) and luminosity (absolute magnitude) for 90% of the stars • 90% of stars lie along a band called the main sequence • Plot of luminosity vs. temperature is called the Hertzsprung-Russell diagram • or just H-R diagram for short. • The following slides show different examples of H-R diagrams. Astronomy 2010
HR Diagram each point on this plot represents the absolute magnitude (luminosity) and color (temperature) of a star • Sun: • +4.8 magnitude • B-V color index 0.62
classes: familiar stars spectral class luminosity (solar units) temperature (Kelvin)
H-R Diagram classes: • main sequence • 90% of stars • large blue stars • medium yellow stars • small red stars • supergiants • giants • white dwarfs Astronomy 2010
17.4.2 Main Sequence Stars • mass • Rigel (blue giant) ~ 16x Sun • Proxima Centauri (red dwarf) ~ 0.4x Sun • size • Rigel ~ 7x Sun, Proxima ~ 0.6x Sun • color = surface temperature • Rigel (blue) 28,000 K, Sun (yellow) 6000 K, Proxima (red) 3,500 K • spectrum = chemical composition • Rigel B, Sun G, Proxima Centauri M • luminosity • Rigel 27,000x Sun, Proxima 0.05x Sun Astronomy 2010
Main Sequence Star Properties Astronomy 2010
Color-Magnitude • H-R diagram also called a color-magnitude diagram • All stars visible to the naked eye (magnitude =< +5) & all stars within 25 parsecs. • Luminous stars • easier to observe • rarer in the galaxy. • Mostly in top half of the H-R diagram. • Faint stars • harder to see • more common in the galaxy. • Mostly in bottom half of the H-R diagram. Astronomy 2010
The Other 10% of Stars • About 10% of stars • don't follow the mass-luminosity relationship • don't lie on the main sequence • Giant and Supergiant stars • upper right of the HR diagram. • large in diameter because very luminous even though they are cool. • White dwarfs • lower left of the HR diagram. • small diameter (Earth-sized) • hot but dim Betelgeuse Astronomy 2010
Main Sequence: Typical Stars • Is the Sun an "average'' or "typical''? • The meaning of "average'' depends on how one chooses the sample! • Compared to the nearby stars, the Sun is luminous, hot, and big. • Compared to the apparently bright stars, the Sun is dim, cool, and small. • Compared to the stars in globular clusters, the Sun is very young. • Compared to the stars in open (galactic) clusters, the Sun is very old. Astronomy 2010
Our Sun compared to… • From Hipparcus survey. • Most stars that appear bright in our sky are also intrinsically luminous • Near stars are all within 7.63 parsecs of the Sun. • Near stars are mostly cool and faint. the 100 (apparent) brightest stars in our sky and the 100 nearest stars. Astronomy 2010
More comparisons… Proportions of the spectral types for each group. Bright Stars: • Most of the apparently bright stars are hot and luminous A and B-type stars. • Includes a few of the very hot O-type stars. • All but one of the K-type stars in the bright star sample are giants or supergiant stars. • All of the M-type stars are giants or supergiants. Astronomy 2010
More comparisons… • Proportions of the spectral types for each group. • Near Stars • Look different from bright stars. • Majority of near stars are cool and faint K and M-type stars. • Only one star in the entire sample is a giant star. • Rest are main sequence stars. Astronomy 2010
Representative Sample • Which of these samples is more representative of the entire population of stars in our galaxy? • A representative sample includes all parts of the population of the objects your are investigating in their proper proportions. • The relative proportion of common things will be greater than the relative proportions of rare things. • In fact, the uncommon things may not be found in a small representative sample because they are so rare! Astronomy 2010
Summary • A careful census of stars leads to a number of conclusions: • Stars have a wide range of masses, luminosities, temperatures, and sizes. • The most common stars are smaller and less luminous than the Sun. • The stars organize into an understandable pattern on the H-R diagram. • Binary star systems are common and useful for measuring masses. • Several techniques exist for measuring diameters of stars. Astronomy 2010