Download
1 / 41
450 likes | 739 Views
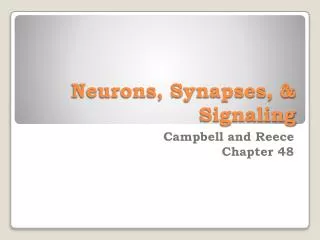
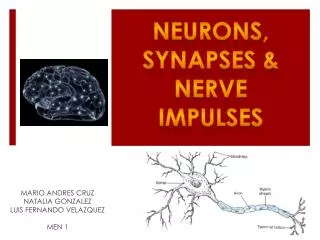
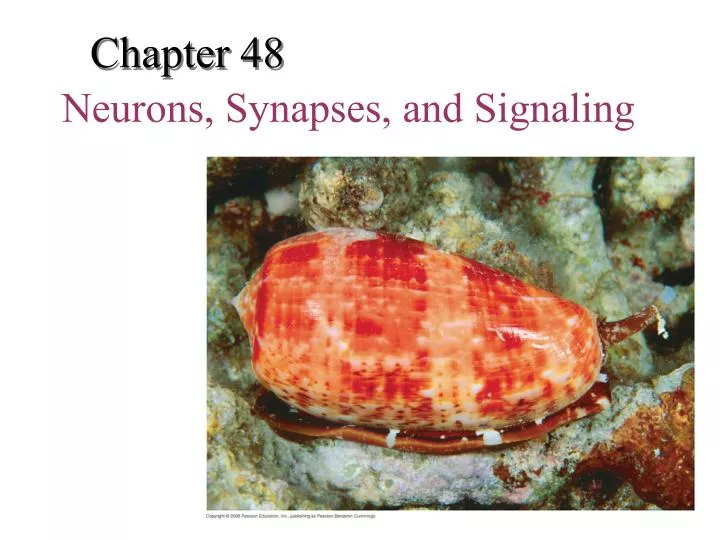
Chapter 48. Neurons, Synapses, and Signaling. Nerves with giant axons. Ganglia. Fig. 48-2. Brain. Arm. The squid possesses extremely large nerve cells and is a good model for studying neuron function. Eye. Mantle. Nerve. Intracellular recording. Fig. 48-8. TECHNIQUE. Microelectrode.

E N D
Chapter 48 Neurons, Synapses, and Signaling
Nerves with giant axons Ganglia Fig. 48-2 Brain Arm The squid possesses extremely large nerve cells and is a good model for studying neuron function Eye Mantle Nerve
Intracellular recording Fig. 48-8 TECHNIQUE Microelectrode Voltage recorder Reference electrode
Fig. 48-3 Sensory input Integration Sensor Motor output Central nervous system (CNS) Effector Peripheral nervous system (PNS)
Dendrites Stimulus Fig. 48-4 Presynaptic cell Nucleus Axon hillock Cell body Axon Synapse Synaptic terminals Postsynaptic cell Neurotransmitter
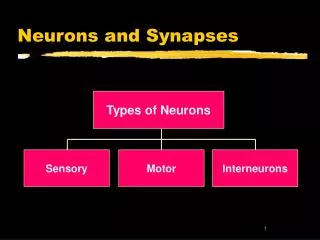
Fig. 48-5 Dendrites Axon Cell body Portion of axon 80 µm Cell bodies of overlapping neurons Sensory neuron Interneurons Motor neuron
Concept 48.2: Ion pumps and ion channels maintain the resting potential of a neuron Fig. 48-6 Key Sodium- potassium pump Na+ Potassium channel Sodium channel K+ OUTSIDE CELL [Na+] 150 mM [Cl–] 120 mM OUTSIDE CELL [K+] 5 mM [A–] 100 mM [K+] 140 mM INSIDE CELL [Na+] 15 mM [Cl–] 10 mM INSIDE CELL (a) (b)
Resting potential can be modeled by an artificial membrane that separates two chambers The concentration of KCl is higher in the inner chamber and lower in the outer chamber K+ diffuses down its gradient to the outer chamber Negative charge builds up in the inner chamber At equilibrium, both the electrical and chemical gradients are balanced Modeling of the Resting Potential The plasma membrane of a resting neuron contains many open potassium channels but only a few open sodium channels)
Chemical concentrations • Ion channels— selective permeability or gated ion channels Fig. 48-7 –90 mV +62 mV Inner chamber Outer chamber 150 mM 140 mM 15 mM 5 mM KCI NaCI KCI NaCI Cl– K+ Na+ Cl– Sodium channel Potassium channel (b) Membrane selectively permeable to Na+ (a) Membrane selectively permeable to K+ ( ( ) ) 5 mM 150 mM ENa = 62 mV log log = –90 mV = +62 mV EK = 62 mV 140 mM 15 mM
Graded potentials: the magnitude of the change in membrane potential varies with the the strength of the stimulus. Fig. 48-9 Stimuli Stimuli Strong depolarizing stimulus +50 +50 +50 Action potential 0 0 0 Membrane potential (mV) Membrane potential (mV) Membrane potential (mV) Threshold Threshold –50 –50 Threshold –50 Resting potential Resting potential Resting potential Depolarizations Hyperpolarizations –100 –100 –100 1 2 3 5 4 0 2 3 4 0 1 5 0 1 3 5 6 2 4 Time (msec) Time (msec) Time (msec) (b) Graded depolarizations (c) Action potential (a) Graded hyperpolarizations
Stimuli Hyperpolarization: Stimulusincrease the outflow of positive ions or the inflow of negative ionsthe separation of charge or polarity increase. (-60~-80-90 mV) +50 K+ Fig. 48-9a 0 Membrane potential (mV) –50 Threshold Resting potential Hyperpolarizations –100 1 5 2 3 4 0 Time (msec) (a) Graded hyperpolarizations
Stimuli Depolarizatiom: The reduction in the magnitude of the membrane potentials often involves gated sodium channels +50 Fig. 48-9b Na+ 0 Membrane potential (mV) Threshold –50 Resting potential Depolarizations –100 0 1 5 2 3 4 Time (msec) (b) Graded depolarizations
Strong depolarizing stimulus Action potential 1.Threshold 2. All or none +50 Action potential Na+ Fig. 48-9c 0 Membrane potential (mV) -55 mV Threshold –50 Resting potential –100 0 2 4 5 6 1 3 Time (msec) A voltage-gated ion channels that open or close in response to a change in the membrane potential
Key Na+ K+ Fig. 48-10-1 +50 Action potential 3 0 Membrane potential (mV) 2 4 Threshold –50 1 1 5 Resting potential Depolarization –100 Time Extracellular fluid Sodium channel Potassium channel Plasma membrane Cytosol Inactivation loop Undershoot Resting state 1
Key Na+ K+ Fig. 48-10-2 +50 Action potential 3 0 Membrane potential (mV) 2 4 Threshold –50 1 1 5 Resting potential Depolarization 2 –100 Time Extracellular fluid Sodium channel Potassium channel Plasma membrane Cytosol Inactivation loop Undershoot Resting state 1
Key Na+ K+ Fig. 48-10-3 Rising phase of the action potential 3 +50 Action potential 3 0 Membrane potential (mV) 2 4 Threshold –50 1 1 5 Resting potential Depolarization 2 –100 Time Extracellular fluid Sodium channel Potassium channel Plasma membrane Cytosol Inactivation loop Undershoot Resting state 1
Key Na+ K+ Fig. 48-10-4 Falling phase of the action potential 4 Rising phase of the action potential 3 +50 Refracory periods: 1. The inactivation of sodium channels In one direction Action potential 3 0 Membrane potential (mV) 2 4 Threshold –50 1 1 5 Resting potential Depolarization 2 –100 Time Extracellular fluid Sodium channel Potassium channel Plasma membrane Cytosol Inactivation loop Undershoot Resting state 1
Key Na+ K+ Fig. 48-10-5 Falling phase of the action potential 4 Rising phase of the action potential 3 +50 Action potential 3 0 Membrane potential (mV) 2 4 Threshold –50 1 1 5 Resting potential Depolarization 2 –100 Time Extracellular fluid Sodium channel Potassium channel Plasma membrane Cytosol Inactivation loop Undershoot 5 Resting state 1 The membrane’s permeability to K+ than it is at the resting potentials
Axon Fig. 48-11-1 Plasma membrane Action potential Cytosol Na+
Axon Fig. 48-11-2 Plasma membrane Action potential Cytosol Na+ Action potential K+ Na+ K+
Axon Fig. 48-11-3 Plasma membrane Action potential Cytosol Na+ Action potential K+ Na+ K+ Action potential K+ Na+ K+
The speed of an action potential increases with the axon’s diameter In vertebrates, axons are insulated by a myelin sheath, which causes an action potential’s speed to increase Myelin sheaths are made by glia—oligodendrocytes in the CNS and Schwann cells in the PNS Conduction Speed
A. myenlin sheath • 1.Oligodendrocyte (CNS)and Schwann cells (PNS) • 2. As increasing the axon’s diameter: Its space efficency • B. Those myelinated axons can be packed into the space Fig. 48-12 Node of Ranvier Layers of myelin Axon Schwann cell Schwann cell Nucleus of Schwann cell Nodes of Ranvier Axon Myelin sheath 0.1 µm
Action potentials in myelinated axons jump between the nodes of Ranvier in a process called saltatory conduction Fig. 48-13 Schwann cell Depolarized region (node of Ranvier) Cell body Myelin sheath Axon
Electrical synapse Chemical synapse Fig. 48-14 Postsynaptic neuron Synaptic terminals of pre- synaptic neurons 5 µm
Fig. 48-15 5 Na+ K+ Synaptic vesicles containing neurotransmitter Presynaptic membrane Voltage-gated Ca2+ channel Postsynaptic membrane Ca2+ 1 4 6 2 3 Synaptic cleft Ligand-gated ion channels
Postsynaptic potentials fall into two categories: Excitatory postsynaptic potentials (EPSPs)are depolarizations that bring the membrane potential toward threshold Inhibitory postsynaptic potentials (IPSPs) are hyperpolarizations that move the membrane potential farther from threshold After release, the neurotransmitter May diffuse out of the synaptic cleft May be taken up by surrounding cells May be degraded by enzymes Generation of Postsynaptic Potentials
Generation of Postsynaptic Potentials Fig. 48-16 Terminal branch of presynaptic neuron E1 E1 E1 E1 E2 E2 E2 E2 Axon hillock Postsynaptic neuron I I I I 0 Action potential Action potential Threshold of axon of postsynaptic neuron Membrane potential (mV) Resting potential –70 E1 + I I E1 E1 E1 E1 E1 E1 + E2 (b) Temporal summation (d) Spatial summation of EPSP and IPSP (a) Subthreshold, no summation (c) Spatial summation
Unlike action potentials, postsynaptic potentials are graded and do not regenerate Most neurons have many synapses on their dendrites and cell body A single EPSP is usually too small to trigger an action potential in a postsynaptic neuron If two EPSPs are produced in rapid succession, an effect called temporal summation occurs Summation of Postsynaptic Potentials
Terminal branch of presynaptic neuron E1 E1 Fig. 48-16ab E2 E2 Axon hillock Postsynaptic neuron I I 0 Action potential Threshold of axon of postsynaptic neuron Membrane potential (mV) Resting potential –70 E1 E1 E1 E1 (a) Subthreshold, no summation (b) Temporal summation
In spatial summation, EPSPs produced nearly simultaneously by different synapses on the same postsynaptic neuron add together The combination of EPSPs through spatial and temporal summation can trigger an action potential Through summation, an IPSP can counter the effect of an EPSP The summed effect of EPSPs and IPSPs determines whether an axon hillock will reach threshold and generate an action potential
E1 E1 Fig. 48-16cd E2 E2 I I 0 Action potential Membrane potential (mV) –70 E1 E1 + I E1 + E2 I (d) Spatial summation of EPSP and IPSP (c) Spatial summation
Neurotransmitters Table 48-1
Acetylcholine ~is a common neurotransmitter in vertebrates and invertebrates ~ In vertebrates it is usually an excitatory transmitter Table 48-1a Biogenic amines include epinephrine, norepinephrine, dopamine, and serotonin ---They are active in the CNS and PNS
Two amino acids are known to function as major neurotransmitters in the CNS: gamma-aminobutyric acid (GABA) and glutamate Table 48-1b
substance P and endorphins,which both affect our perception of pain Opiates bind to the same receptors as endorphins and can be used as painkillers Gases such as nitric oxide and carbon monoxide are local regulators in the PNS Heme oxygenase CO regulates the release of hypothalamic hormones in CNS In the PNS, it acts as an inhibitory neurotransmitter that hyperpolarizes intestinal smooth muscle cells.
EXPERIMENT Radioactive naloxone Fig. 48-17 Drug Protein mixture Proteins trapped on filter Measure naloxone bound to proteins on each filter RESULTS
Action potential +50 Fig. 48-UN1 Falling phase 0 Rising phase Membrane potential (mV) Threshold (–55) –50 Resting potential –70 Depolarization Undershoot –100 Time (msec)
Distinguish among the following sets of terms: sensory neurons, interneurons, and motor neurons; membrane potential and resting potential; ungated and gated ion channels; electrical synapse and chemical synapse; EPSP and IPSP; temporal and spatial summation Explain the role of the sodium-potassium pump in maintaining the resting potential You should now be able to:
Describe the stages of an action potential; explain the role of voltage-gated ion channels in this process Explain why the action potential cannot travel back toward the cell body Describe saltatory conduction Describe the events that lead to the release of neurotransmitters into the synaptic cleft
Explain the statement: “Unlike action potentials, which are all-or-none events, postsynaptic potentials are graded” Name and describe five categories of neurotransmitters