Download
1 / 25
250 likes | 264 Views
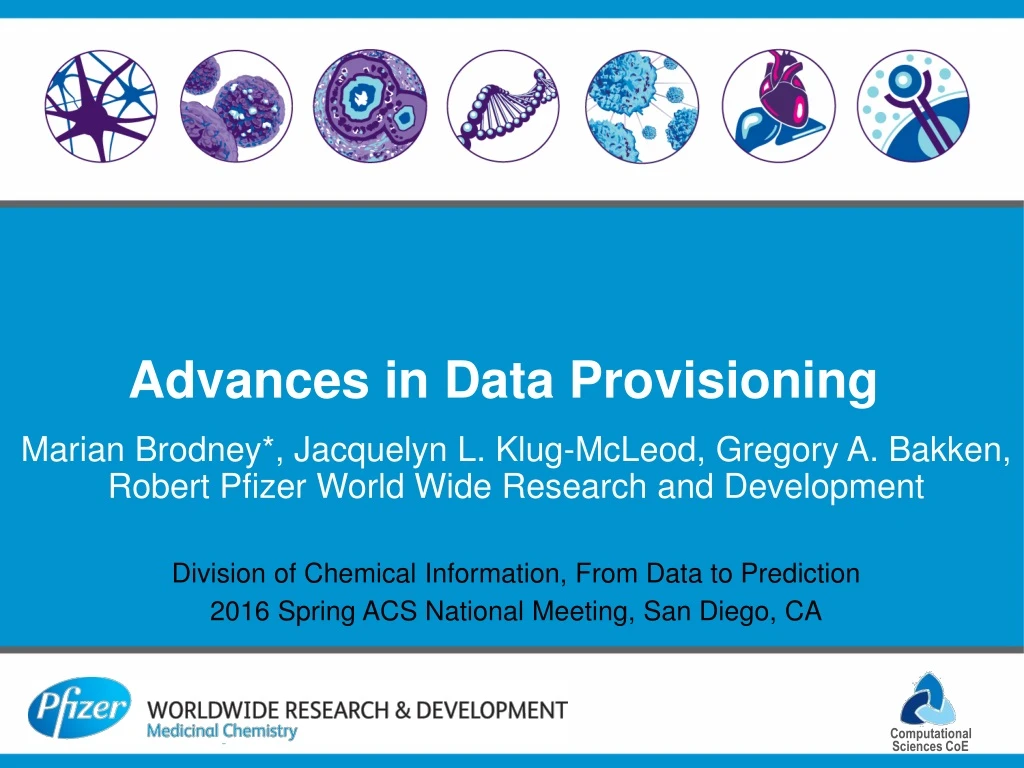
Advances in Data Provisioning. Marian Brodney*, Jacquelyn L. Klug-McLeod, Gregory A. Bakken, Robert Pfizer World Wide Research and Development Division of Chemical Information, From Data to Prediction 2016 Spring ACS National Meeting, San Diego, CA. Outline.

E N D
Advances in Data Provisioning Marian Brodney*, Jacquelyn L. Klug-McLeod, Gregory A. Bakken, Robert Pfizer World Wide Research and Development Division of Chemical Information, From Data to Prediction 2016 Spring ACS National Meeting, San Diego, CA
Outline • Discovery medicinal chemistry is a data driven process • Discovery project teams use, gather and produce large amounts of data • Different kinds of data from different disciplines of the teams • Strong desire for enabled automated process providing integrated support for data provisioning, capture and visualization with user input • Portfolio solution applied across projects and therapeutic areas
Drug Discovery Process Image: http://www.slideshare.net/PowerPoint-Templates/drug-discovery-process-style-5-powerpoint-presentation-templates With each phase in the drug discovery process there is data generated. Different varieties of data, often stored in different data sources feed the progress along the discovery pathway; ALL DATA generated is used in decision making
Drug Discovery Data Sources Synthesis information Patents In Vivo Assay details In vivo Assay details PubMed Competitive Intetel Literature In vivo Assay data Compiled information Into user-friendly format(s) In Vivo Assay details Gene Table Targets BioInfo NIH Cortellis Dose Models Computed properties CheMBL HTS PDMModels Comp models Compound properties Machine learning Compound tracking Design information Vendor Safety
Discovery MedChem Cycle Data Challenges • Difficult for discovery project teams to extract and collate all relevant data of interest • Data from different sources and in various formats • Aggregation rules • Data formatting/munging • Query times extend with the number of data sources used • Calculations/computational tools used on full data set, extends query time • Typical project information file can have 200-500 columns of data for several thousands of compounds • Several hours to run • Teams need relevant and up-to-date data at their fingertips provided in user-friendly format for daily use to drive project progression Design Cycle
Solution: Automated Data Presentation (ADP) • ADP : project data driven file providing foundation for all aspects of project informatics enabling links between design, synthesis and technology and strengthening these connections through rapid information exchange. • ADP files are the foundation of data compiled to support medchem project teams • Support solutions to ongoing medicinal chemistry problems • Examples: compound summaries, compound and design tracking, property/data visualizations • Enable analytics for discovery project teams • Examples: R group de-convolutions, series annotation, pair-wise analysis (MMP) • Enables solutions to enhance project work flow • Examples: linking design objectives to virtual compounds, virtual compounds to synthesized compounds, design cycles, synthesis queue workflows • Global Project infrastructure • Examples: global level alerts and data support to in-house tools, enables reporting across projects for full portfolio view
Definition of Data Types • Project specific data • Any assay data not covered by common data (outlined below) • In vivo, in vitro, PDM, synthesis tracking, etc. • Common data • Assays used across all projects • Platform data (ADME, CEREP, KSS panel, etc.) • Project specific calculations • Series definitions, R-Group deconvolutions, dose models • Common Calculations • Used across all projects • global cADME models, cLogP, cLogD, compound computed properties, etc.
ADP: Definition • ADP • Automated Data Presentation • Retrieval of assay data for real(synthesized) compounds • Calculations • Property and other calculations • Series annotations, RGroup deconvolution, LipE, etc. • All relevant data pulled from various sources and merged on compound level updated on a set schedule • VCP • Virtual Compound Presentation • Calculations for virtual compounds • Functionality for VCP is a subset of what is needed for ADP
ADP: Version 1 Internally Developed Solution • A generalized automated process developed by cheminformatics group using protocols written in Pipeline Pilot to retrieve all compounds and relevant data of interest to a team to enable project progression • Scheduled output results (includes most recent data), refreshed as often as data updated (every 15 min) • Addresses problem of speed/stability • Drivenby team-modifiable input (assay dependant, project code dependent) • Various aggregation levels • Customizable—logic, sorting, filtering, annotations, external data sources, etc • Project specific and global platform data • Compounds can be synthesized and/or a combination of reals and virtuals • Data is available in various visualization tools
ADP: Version 1 Problems: Complicated process managed by 4-6 people Supporting ~65 teams Project teams did not have DIRECT control of data Refreshes/changes upon request
ADP: Version 2 Vendor Developed Solution • Teams have more direct control of their data in D360 • Selection of aggregation category • Logic/sorting/equations/annotations • Presentation of data set output in customizable forms or lists (conditional coloring, sorting, manipulation, etc) • Can schedule output results to update nightly • Drivenby team-modifiable input (assay dependant, project code dependent) • Project specific and global platform data • Compounds can be synthesized (reals) or a combination of reals and virtuals • Data is available in various visualization tools Problems: Lack of Stability Inconsistent capability with internal tools/systems Long running/large queries not well supported Short scheduling window (1x day) No direct export of files Teams not able to get the data sets they need in a recent amount of time
ADP: Version 3 • Using D360 as front end for project-initiated queries • Project teams still OWN their D360 queries • Direct control of data input/level of aggregation, etc. • Logic/sorting/equations/annotations/customizations • Schedule to run nightly • Can update/refresh as needed (via schedule window) • To minimize complexity of the queries, specify only project specific information in D360 queries • Queries for ALL desired data not supportable. • Internal Pfizer team (CSCoE) developed a data provisioning platform to pick up D360 query files, add additional global data and deposit the full project files into shared folders for direct application access • Global/platform data provided via the secondary PLP process • Full project files provided to teams and updated with each D360 refresh Hybrid Developed Solution • Combined benefits of vendor and Legacy internal Process
ADP: Version 3 Internal tools Spotfire 6.5 Tools reconfigured for uniform access to data
ADP: Version 3 D360 Scheduled Query 1. D360 – nightly scheduled query to bring in new data, but the same query can be manually run from the scheduled queries dialog if desired (immediate access to new data) 2. Pipeline Pilot – retrieves data file from D360 system and can add/manipulate data file as desired, including adding platform data. Final flat file saved to a network location. Pipeline Pilot Taken from: https://community.accelrys.com/thread/4959 Spotfire 3. Upon opening Spotfire DXP (or tool of choice), the user is presented with previously saved views (can be incredibly complex) of the updated data file allowing for in depth analysis Taken from: http://www.pressebox.com/attachment/34940/Spotfire_DXP_1.1.png
ADP Visualizations View of Kinase panel data at various doses (1, 10, 50uM) on Kinome Tree for specific project Detail view highlights potency/intrinsic activity relationship for selected headpiece MPO score facilitates pairwise analysis in understanding the SAR around core modification
ADP Visualizations (cont.) Tracking project external vendor queue in relation to project design priority. Multi-parameter Summary: Average property trends for 2 series relative to stated design objectives Tracking project external/internal synthesis queue colored by source.
ADP Visualizations (cont.) MPO-NSG facilitates identification of SAR clusters with optimal property space alignment (clusters E and F) and those with in continuous, low MPO space (clusters A, B, C, and D).
ADP Visualizations (cont.) Pfizer’s BACE series Effect of log D and pKa on hERG IC50. (A) Diverse Pfizer set of 2044 compounds. (B) Set of 169 BACE compounds from property space I and II. Red, hERG IC50 < 10 μM; blue, hERG IC50 > 10 μM. Total count per bin is highlighted in the center of the pie. Brodney et al J. Med. Chem. 2015, 58, 3223−3252
ADP Visualizations (cont.) Pfizer’s Early LpxCSeries Goals – remove alkyne, reduce clearance, improve solubility Results – attractive series with wild type Pae in vivo activity, but challenging synthesis and limited spectrum. Warmus et al., BOMCL (2012), 22(7), 2536
ADP Visualizations: Portfolio Roll Up Interactive DXP Dashboard tool • Project ADP files enable portfolio level tool • Track project progression over time across zones • Identify common issues for collaboration Help to identify project bottle-necks as well as highlight efficiencies
Summary • Drug discovery is data driven process • Essential to have all relevant information for decision making • CSCoE group developed an automated global platform process to provide all relevant data to project teams as ADP files • ADP files provide the foundation for all aspects of project informatics enabling links between design, synthesis and technology and strengthening these connections through rapid information exchange
Acknowledgments Pfizer Global Research and Development: Departments • Computational Sciences Center of Emphasis (CSCoE) • Cheminformatics (legacy) • Discovery Medicinal Chemistry (WWMC) • Business Technology (BT) Pfizer Global Research and Develop Project Teams IDE Development Team Global ADP team External Companies • Accelrys/Bovia • Cetera • Tibco
Acknowledgments • Groton ChemInformatics/DADA • Artie Brosius • Marian Brodney • Chris Poss • Steve Heck • Tracy Gregory • Jacquelyn Klug-McLeod • Alan Mathiowetz • Brian Bronk • Jared Milbank • Accelrys/Bovia • Andrei Caracoti • Dimitri Bondarev • Klaus Dress • Bruce Lefker • Greg Bakken • Tien Sng • Brock Luty • Lourdes Cucurull-Sanchez • Mike Linhares • Josh Du • Veer Shanmugasundaram • Rob Stanton • Chris Kibbey • Steve Rieth • Justin Montgomery • Robert Owen • Bruce Rogers
ADP Visualizations (cont.) PyridoneMethylsulfoneHydroxamates • General trend of increasing free fraction with increasing polarity • MICs drop off if cLogD drops below 0 • Free fraction too low if cLogD is too far above 1 More polar but still active cores discovered. Montgomery et al., J. Med. Chem. 2012, 55, 1662.