Download
1 / 20
200 likes | 216 Views
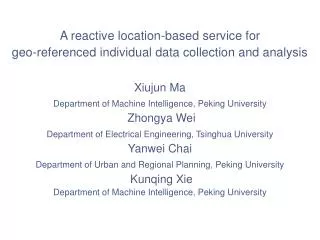
This project presents a real-time clustering algorithm for visualizing large amounts of geo-referenced data on a map. The proposed grid-growing algorithm overcomes the limitations of traditional clustering approaches and allows for efficient and accurate clustering of data points. The system is suitable for real-time applications with low bandwidth and offers a novel approach to web mapping systems.

E N D
Real-Time Clustering of Large Geo-Referenced Data for Visualizing on Map Presenter: Rushikesh Sane Course: LAMI, Spring 2019 6th February2019
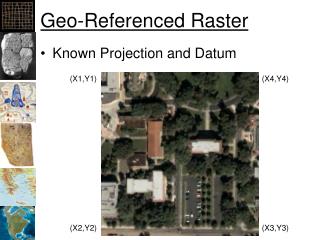
Real-Time Geo-Referenced Data Clustering
VisualizingLARGEamount of data PredefinedFilters Clutter Slowness
Clustering Problem • Number of Clusters • Minimizing SSE
Whynotthese? DBSCAN K Means Hasdifferent objective Need to determine k in advance Hightimecomplexity O(N3) Hierarchical
Grid-basedSteps Grid Construction Initial Clustering Grid Construction
Grid-basedapproach in clustering OverlappingClusters Cluster aftermerge
Proposedapproach Client Server PrepareQuery and Parameters Queryfrom database • Grid construction • InitialClusters in thecell OverlapAcross Neighboringcells Displaycluster on Map Information of eachcell
Experiments Processing time of 3 clustering approaches Clustering quality with 100 data points Veryfast! Comparison with Google cluster marker API
Steps • Grid Construction • Borderspassthroughmax & min co-ordinates • Initialseeds (randomor top m dense) • 2. Grid Growing • m initialseeds • 4 or 8 neighbors 3. Partitioning 4-neighborhood 8-neighborhood
Experiments Litekmeans: Fastestimplementation of k means in matlab GEM: Greedyexpectation-maximizationalgorithm (gaussianmixturemodel) DBSCAN: Densitybasedclusteringalgorithm LSC: Landmarkspectralclustering (graphbasedalgorithm) PRS: Pairwiserandomswap GG: Grid Growing Leasttime Optimalstrategysuggestedbyauthors Time required Leastclustersdetected Maximum clustersdetected Efficiency of algorithm & number of clustersdetected
Conclusion • Novel idea of web mapping system based on clustering to make real time queries. • First ever system to allow fetching query results up to 1M objects. • Suitable for real time applications having low bandwidth. • Theproposedgrid-growingalgorithmpossesestheadvantages of both k-means and DBSCAN. • Time complexityis O(nlogn). • Overcomesalldifficultiesrelated to geo-taggedrealtimeapplications.
Thankyou Real-Time Clustering of Large Geo-Referenced Data for Visualizing on Map Mohammad Rezaei, PasiFranti Link: http://cs.uef.fi/sipu/pub/aece_2018_4_8.pdf A grid-growing clustering algorithm for geo-spatial data QinpeiZhaoa, Yang Shi Qin Liua, PasiFränti Link: http://cs.uef.fi/sipu/pub/Grid_growing_Zhao_2015.pdf OtherReferences: Gifs on slide 5 – https://giphy.com/gifs/dendrogram-dashee87githubio-scikit-pSNCWCEAsgrAs https://giphy.com/gifs/dbscan-dashee87githubio-scikit-OVJBPIB6oL3a0 https://giphy.com/gifs/needs-dashee87githubio-scikit-3NKUcoyBzkXQc
Techniques to Visualize Data Technique for Data Reduction ShowingDensity Representation of Cluster ShowingDistribution Opening a Cluster Details on Demand
Resistance to Problemsdue to Panning PanningProblem Solution: Initializethegridonlyone at thebeginning. A pointassigned to one box willremainassigned to it evenafterpanning. Butwetakeonlythoseobjects into considerationwhicharecompletelyorpartially Visible in thecurrentview.
VoronoiDiagram In mathematics, a Voronoi diagram is a partitioning of a plane into regions based on distance to points in a specific subset of the plane. That set of points (called seeds, sites, or generators) is specified beforehand, and for each seed there is a corresponding region consisting of all points closer to that seed than to any other. These regions are called Voronoi cells.
Whatif data point and grid-lineoverlap? Point could be placed in any of the adjacent cells. It’s a trivial issue. One can place it in more dense cell.