Download
1 / 19
190 likes | 313 Views
Air Transportation Systems Lab Virginia Tech Oshkosh, WI July 29- August 3, 2003. Transportation Systems Analysis for the SATS Program. Credits. Dr. A.A. Trani (Project Lead) Dr. H. Baik and H. Swingle (Research Scientists)

E N D
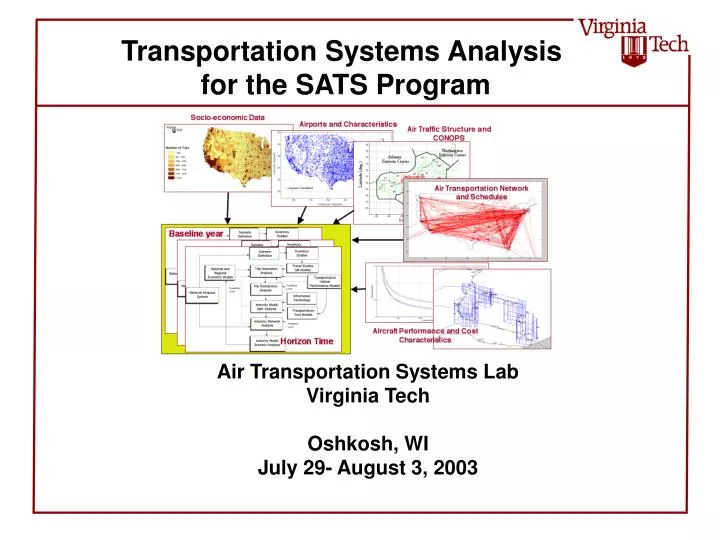
Air Transportation Systems LabVirginia TechOshkosh, WIJuly 29- August 3, 2003 Transportation Systems Analysis for the SATS Program
Credits • Dr. A.A. Trani (Project Lead) • Dr. H. Baik and H. Swingle (Research Scientists) • A. Ashiabor, S. Seshadri, K. Murthy, and N. Hinze (Graduate Research Associates)
Integrated Transportation System Decision Support Model NAS Metrics Travel time Economic benefits Noise Traffic densities Energy use Blue = Dynamic Model Yellow = Aerospace Technology
Socio-economic Data Airports and Characteristics Air Traffic Structure and CONOPS Air Transportation Network and Schedules Baseline year Aircraft Performance and Cost Characteristics Horizon Time Integrated Transportation System Decision Support Model
Tiltrotor/RIA Hypersonic Helicopter Subsonic GA / Corporate Supersonic The Role of Aerospace Technology in the Transportation DSM NAS Metrics Travel time Economic benefits Noise Traffic densities Energy use
Questions to be Answered with the Decision Support Model • Reduce the travel time from door-to-destination by n percent • What price for aerospace technology x is needed to achieve y(%)increase in air transportation demand? • Use the integrated transportation systems model to investigate what aerospace technologies are needed to achieve the goal • What is the impact of aerospace technology x in the fuel, energy consumption and the environment?
Person-trips per Year per Household Years After High School Annual Household Income ($) Trip Demand Generation Given: Socio-economic characteristics for each county (for all states) Predict: a) Number of trips produced per household/year for various income levels b) Trips attracted to a county Use: Trip rate tables
Intercity Trip are Influenced by Income and Trip Purpose Data: ATS 1995 Percent Travelers by Air (%) High Income Medium Income Low Income One-Way Trip Distance (miles)
U.S. County Population Forecast(2000-2025) Woods and Poole Economic Model
Average U.S. County HouseholdIncome Forecast (2000-2025) Woods and Poole Economic Model
Trip Distribution Analysis Given: Trips produced from and attracted to each county Predict: a) Number of person-trips from each origin to every destination (county to county) Use: Gravity Model
Given: Trips from each origin to each destination Predict: a) Number of person-trips for every mode of transportation available Use:NestedMultinomial Logit Model and Diversion Curves Transportation Modal Split Key variables: travel cost, door-to-door travel time, perceived safety
Travel patterns are heavily influenced by cost economics 3348 Airports Towered Airports (474) Hub Airports (135) Large Hub Airports (30) Census 1990 and 2000 Data with 61,224 tracts in NAS Location of Airports and PopulationInfluences Mode Split
SATS vs. Other Modes:Very Light Jet Aircraft Cost Assumptions on SATS travel: jet aircraft, less than 10,000 pounds total weight, utilized 500 hours per year, no deadhead legs, 3 passengers, two pilots.
SATS vs. Other Modes:Very Light Jet Aircraft Cost Assumptions on SATS travel: jet aircraft, less than 10,000 pounds total weight, utilized 500 hours per year, no deadhead legs, 3 passengers, one pilot.
Flight Trajectory Aircraft Model Airbus A320 Jacksonville - Miami Flight trajectory module employs the Eurocontrol’s BADA model
Concluding Remarks • An integrated transportation model has been developed • The model can be used in the evaluation of future aerospace technologies • The model is flexible enough to incorporate new assumptions and models developed elsewhere • National-level environmental impacts require a model capable of expressing spatial demand and supply patterns (I.e., equivalent to FEM/CFD techniques used in aerospace)