1 / 8

Graphing Linear Inequalities

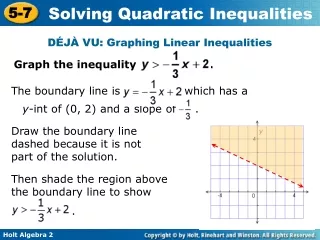
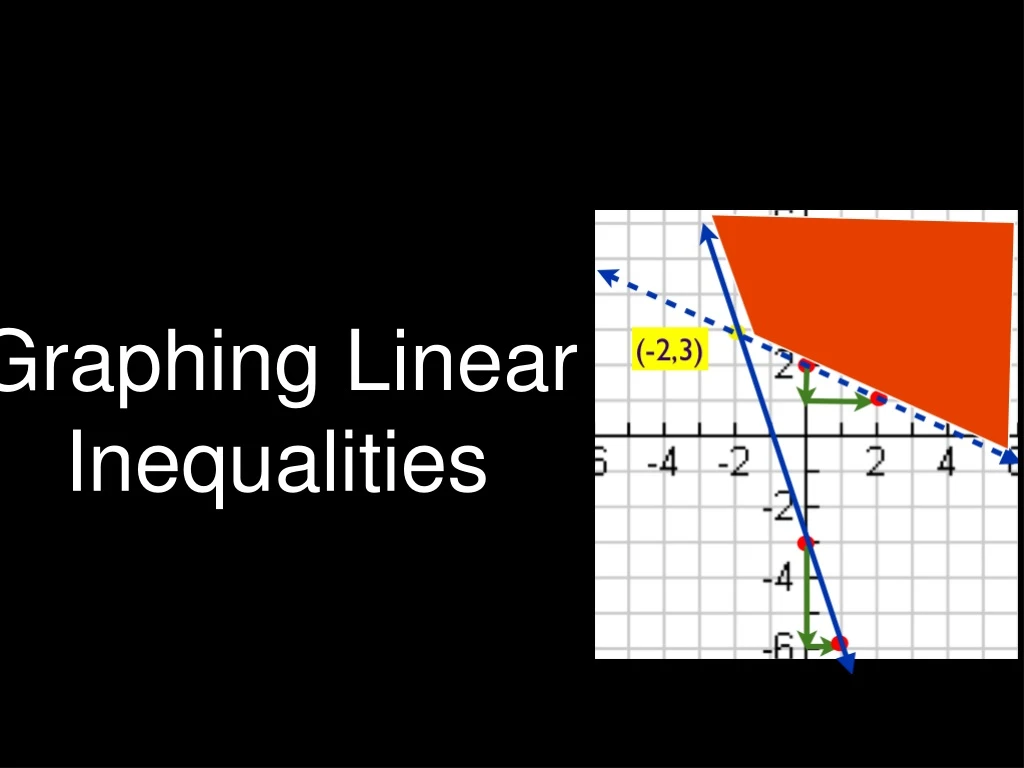
Learn how to graph linear inequalities and solve systems of linear equations with examples and practice exercises.

hutchinsh
Download Presentation

Graphing Linear Inequalities

An Image/Link below is provided (as is) to download presentation Download Policy: Content on the Website is provided to you AS IS for your information and personal use and may not be sold / licensed / shared on other websites without getting consent from its author. Content is provided to you AS IS for your information and personal use only. Download presentation by click this link. While downloading, if for some reason you are not able to download a presentation, the publisher may have deleted the file from their server. During download, if you can't get a presentation, the file might be deleted by the publisher.

E N D

Presentation Transcript


  1. Graphing Linear Inequalities

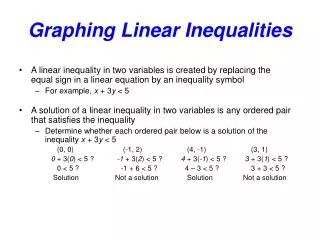
  2. Graphing linear equation Example 1 y = 2x-3

  3. Graphing linear INEQUALITY Example 2 y < 2x-3 Text

  4. Your Turn! y < x-1

  5. Graphing linear INEQUALITY Example 3 y ≥ 2x-3 Text

  6. System of Linear Equations Two or more linear equations together form a system of linear equations. Your Turn! y ≥ x-1 (2,1)

  7. -2x 3 3 -2x 3 Graphing a linear equation in Standard form:Ax + By = C ● 2x+3y> 12 ● 3y> -2x +12 -⅔x y > -⅔x +4 +4

  8. -15x -3 -3 -15x -3 Your Turn!Standard form:Ax + By = C 15x-3y< 9 ● -3y< -15x +9 ● y > 5x -3 5x -3

More Related