Download
1 / 92
920 likes | 1.13k Views
Subjective Probability Forecasts at the NWS Storm Prediction Center. Dr. Russell S. Schneider Steven J. Weiss NWS Storm Prediction Center. Model Development Laboratory - December 2009. “Where America’s Weather and Climate Services Begin”. Outline. Motivation Background

E N D
Subjective Probability Forecasts at the NWS Storm Prediction Center Dr. Russell S. Schneider Steven J. Weiss NWS Storm Prediction Center Model Development Laboratory - December 2009 “Where America’s Weather and Climate Services Begin”
Outline • Motivation • Background • SPC Probabilistic Products • SPC Unique Guidance & Forecast Tools • Advanced Verification • Current Development • Challenges
NOAA NWS Storm Prediction Center • Forecast tornadoes, thunderstorms, and wildfires nationwide • Forecast information from 8 days to a few minutes in advance • World class team engaged with the research community • Partner with over 120 local National Weather Service offices
Each Year: About 1,500 tornadoes touch down across the United States causing an estimated $1.1 billion in damages and over 80 deaths
Motivation for Probabilities • Capture forecaster’s assessment • Quantify uncertaintyinherent in a forecast • Enable partner-specific risk assessment& decision support • Improvedepth & quality end-to-end offorecast process
Scientific Background • Subjective Probability Forecasting (Sanders, 1963) • Probability is proper internal language of forecasters • Forecasters use: Sorting Process & Labeling Process • Murphy and Collaborators (1974-1995) • Early work with SPC (NSSFC) Forecast Process • Murphy & Winkler (1982): SPC Tornado Watches in 1976-1977 • Murphy et al. (1993): Experimental Convective Outlooks • Other notable papers • Murphy (1991): Probabilities, Odds, and Forecasts of Rare Events • Murphy (1993): Essay on the Nature of Forecast Goodness • Need to effectively capture forecaster judgment • Avoid forecaster product-embedded estimates of user cost-loss model
Basic Methodology • Guidance & Forecast Tools • Forecaster Experience (rare events) • SPC Specialists for Severe Convection • Jack Hales: Lead for 35 years = over 1/5th • Conceptual models important with limited data • Capture Forecaster Information • Communicate Information (multi-tier) • Timely & Effective Feedback
Storm Prediction Center Hazardous Phenomena • Tornadoes, Hail & Wind • Fire weather (Day 1- 8) • Winter weather • Excessive rainfall
“Super Tuesday” Outbreak5 February 2008 56 Fatalities - 15th Largest Death Toll since 1950
Day 4-8 Convective Outlook Operational since March 2007 30% Probability of an Event within 25 mi of a point (“high end” Slight Risk) “Potential too Low” <30 % Probability “Predictability too Low” Widespread severe weather possible, but too much uncertainty to forecast an area Graphic & Short Discussion Issued at 4:00 am Central
Day 3 & Day 2 Convective Outlook Operational since: 2001 & 1986 (categorical); 2001 & 2000 (probabilistic) Probability of Severe Weather within 25 miles of a point Hatched Area --- 10% or greater chance of an extreme event (EF2 or greater tornado, 2” or larger hail, 65 kt or faster gust) DAY AFTER TOMORROW TOMORROW Issued at 2:30 am Central Issued at 1:00 am Central & updated at 1730 UTC Graphic & Discussion Valid for 24 hour period 1200 UTC – 1200 UTC
Day 1 Convective Outlook Operational since 1955 (catagorical) & 2000 (probabilistic) Probability of individual hazards within 25 miles of a point Hatched Areas --- 10% or greater chance of an extreme event (F2 or greater tornado, 2” or larger hail, 65 kt or faster gust) Categorical Risk Tornado Probability Hail Probability Wind Probability Issued at 0600 UTC; updated at 1300, 1630, 2000, 0100 UTC Valid for period ending at 1200 UTC
Reliability of Probabilistic Day 1 Outlooks 2008 Forecast Obs 10% Sig Torn 7.2% 10% Sig Gust 4.5% 10% Sig Hail 7.6%
Convective Outlook Probabilities ROC Charts The concaveness of the ROC curve wrt to the diagonal indicates the value the forecast Day 2 Forecast Observed 10% Prob. Sig 13.3% POD = fraction of events that were correctly forecast FAR = fraction of nonevents that were incorrectly forecast Day 3 Forecast Observed 10% Prob. Sig 9.1%
Relationship between Categorical and Probabilistic Outlooks
Watch Hazard ProbabilitiesAll watches are not created equal Use the probabilities to refine the specific threat within the watch and gauge forecaster confidence in the specific convective hazards Operational since 2006
Reliability of Watch Hazard Probabilities Problem with “significant wind gusts … Observational issue, few measurements… Most estimated from damage (e.g., only 193 reports in 2008)
2008 Watch Hazard Probability Verification Best Case Worst Case POD = fraction of events that were correctly forecast FAR = fraction of nonevents that were incorrectly forecast
0600UTC 9 April 2009 0600Z 9 April 09 VT 16Z-20Z 0600Z 9 April 09 VT 20Z-00Z 0600Z 9 April 09 VT 00Z-04Z 1300UTC 9 April2009 1300Z 9 April 09 VT 16Z-20Z 1300Z 9 April 09 VT 20Z-00Z 1300Z 9 April 09 VT 00Z-04Z Observed Cloud-to-Ground Lightning 16Z-20Z 20Z-00Z 00Z-04Z Thunderstorm Outlooks to Support Aviation
SPC Scientific Approach • Engage the Community (SSB & Forecasters) • Professional Meetings and Conferences • Collaborative Research Projects • Hazardous Weather Testbed • Sift & Winnow • Eye toward specialized mission specific data & tools • Hazardous Weather Testbed (key intermediate step) • Early integration of ensemble forecast systems • Storm-resolving WRF NWP • Storm-scale Ensemble Forecast System • SSB focus onScience Enabling “Structure” • Flexible. Adapt to specific trends as path becomes clear • Multiple dimensions for success and synergy
SPC Science Support Branch Foci • Collaborative Research • HWT Spring Experiments • NSSL, OU, EMC, NCAR, GSD, U. of Albany, Pacific NW Fire Lab • Steve Weiss, David Bright, Phillip Bothwell, Jason Levit, Chris Siewert • Forecast Tools & Guidance • Regional Scale NWP Information Extraction (e.g. SREF guidance) • Storm Scale NWP Information Extraction (e.g. storm scale ensemble) • Interactive Forecast Tools (e.g. NSHARP) • David Bright, Phillip Bothwell, Jason Levit & Steve Weiss • Forecast Product & Storm Environment Database • SPC Administrative & Context Based Verification • Understanding Storms & Supporting Forecast Tools • Andy Dean, Phillip Bothwell, Greg Carbin additional support: Gregg Grosshans, Jay Liang, Joe Byerly
Forecaster GUI for Probabilities… climatology as a reference constrained by “policy” and based on climatology
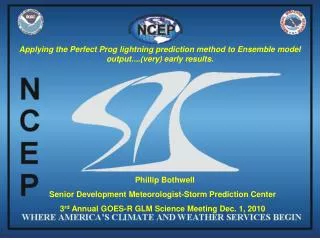
Perfect Prog. Lightning Forecastsincluding Dry Thunderstorm Potential(Bothwell, 2008)
NOAA Hazardous Weather Testbed EWP EFP Experimental Forecast Program Experimental Warning Program GOES-R PG Prediction of hazardous weather events from a few hours to a week in advance Detection and prediction of hazardous weather events up to several hours in advance
Key HWT Contributions to Advances in SPC Operations • Short Range Ensemble Forecast System (SREF) • SREF Workshop (NCEP 1994) • Collaboration on SREF with EMC & NSSL (1999-2002) • SPC focused SREF guidance in Operations (2003) • Developing additional calibrated high impact wx. guidance • Global Ensemble Forecast System (GEFS) • SPC Focused GEFS Guidance in Operations (2005) • Working toward NAEFS tools (2010) • Convection Allowing High Resolution NWP • Experimental WRF data in Operations (2004) • Operational WRF data in Operations (2008)
Example of 39 Hour SREF Calibrated Thunderstorm Forecast Valid: 03-06 UTC 03 May 2008 Bright et al. 2005
Example of 39 Hour SREF Calibrated Thunderstorm Forecast Valid: 03-06 UTC 03 May 2008 Bright et al. 2005
Probability of MCS Maintenance • Logistic Regression applied to sounding parameters, yielded the following significant predictors: • 1) maximum bulk shear (m/s) in the 0-1 and 6-10 km layer2) 3-8 km lapse rate (degrees C/km)3) most unstable CAPE4) 3-12 km mean wind speed (m/s) Coniglio et al. 2006
Post-Processed Short Range Ensemble Forecast Calibrated Severe Thunderstorm Probability Calibration – Computed from conditional probability of Severe Weather given a Thunderstorm Bright & Wandishin 2006
Wide range of high impact SREF guidance are available at the SPC website http://www.spc.noaa.gov/exper/sref/
MDL has a Distinguished History of Probabilistic Forecast Guidance • Pioneering work documented in formal publications • Charba (MWR 1979) • Reap and Foster (JAM 1979) • Technical Reports & Conferences with SPC • R. M. Reap, D. S. Foster, and S. J. Weiss, 1981 • R. M. Reap, D. S. Foster, and S. J. Weiss, 1982 • S. J. Weiss and R. M. Reap, 1984
SPC Day 3 Probabilistic Outlookfor Tuesday 8 December Day 3 SPC Outlook valid 12Z 8 Dec. 24hr Unconditional Severe Thunderstorm Probability (within 25 mi of point) Preliminary Reports valid 12Z 8 Dec. 24hr Compilation 12Z-12Z
NAM & GFS based Severe Thunderstorm Probabilities NAM MOS: 72hr Projection valid 12Z 8 Dec. 24hr Unconditional Severe Thunderstorm Probability GFS MOS: 72hr Projection valid 12Z 8 Dec. 24hr Unconditional Severe Thunderstorm Probability
SREF based Calibrated Severe Thunderstorm Probabilities SREF 69hr Projection valid 12Z 8 Dec. 24hr Calibrated Unconditional Severe Thunderstorm Probability
We need data … robust verification • In a World Without Data, Opinion Prevails • We tend to research the atmosphere, but not ourselves From Scholtes (1998) “The Leader’s Handbook”
Context Based Verification • Support a dynamic learning environment • Provide insights into tactical & strategic challenges
Data & Methodology: • Severe weather reports for 2003-2008 (2009 through August) • Environmental estimate from hourly SPC - RUC meso-analysis • Extract from nearest grid point at hour prior to event • Link report and estimated environment databases by event time & location 175,658 reports | 8334 tornadoes
Low CAPE - Strong Shear High CAPE - Strong Shear Severe Reports Environment Hours ~50hr/yr ~100hr/yr • 24 % of F2+ tornadoes • local axis ~ 40 hr / year • 39 % of F2+ tornadoes • widespread~80 hr / year
50 ms-1 40 ms-1 30 ms-1 0-6 km Shear 20 ms-1 Thunderstorms Common 10 ms-1 100 mb ML CAPE All Tornadoes (total of 6643) Significant Tornadoes
50 ms-1 40 ms-1 30 ms-1 0-6 km Shear 20 ms-1 10 ms-1 100 mb ML CAPE Conditional Probability of Tornadoes (given lightning)
50 ms-1 40 ms-1 30 ms-1 0-6 km Shear 20 ms-1 10 ms-1 100 mb ML CAPE All Watches: Probability of Tornado Detection Overall POD: 0.69; F2+: 0.94
50 ms-1 40 ms-1 30 ms-1 0-6 km Shear 20 ms-1 10 ms-1 100 mb ML CAPE Tornado Watch: Probability of Tornado Detection Overall POD: 0.58; F2+: 0.83
50 ms-1 40 ms-1 30 ms-1 0-6 km Shear 20 ms-1 10 ms-1 100 mb ML CAPE Tornado Watch: Probability of Tornado Detection Overall POD: 0.58; F2+: 0.83 > 60%
50 ms-1 40 ms-1 30 ms-1 0-6 km Shear 20 ms-1 10 ms-1 100 mb ML CAPE Tornado Watch: Fraction of Missed Tornadoes
50 ms-1 40 ms-1 30 ms-1 0-6 km Shear 20 ms-1 10 ms-1 100 mb ML CAPE Tornado Watch: False Alarm Area
50 ms-1 40 ms-1 30 ms-1 0-6 km Shear 20 ms-1 10 ms-1 100 mb ML CAPE Tornado Watch: False Alarm Area
50 ms-1 40 ms-1 30 ms-1 0-6 km Shear 20 ms-1 10 ms-1 100 mb ML CAPE Tornado Watch: Fraction of Missed Tornadoes