Download
1 / 36
360 likes | 464 Views
Interneer Innovate 2014 Growing Interneer Across the Business. Mérieux NutriSciences. Mérieux Nutrisciences provides laboratory, auditing, consulting, contract research and education services to 7 strategic industries. Mérieux NutriSciences’ development. 1990. 2007. 2011-2013. 1967.

E N D
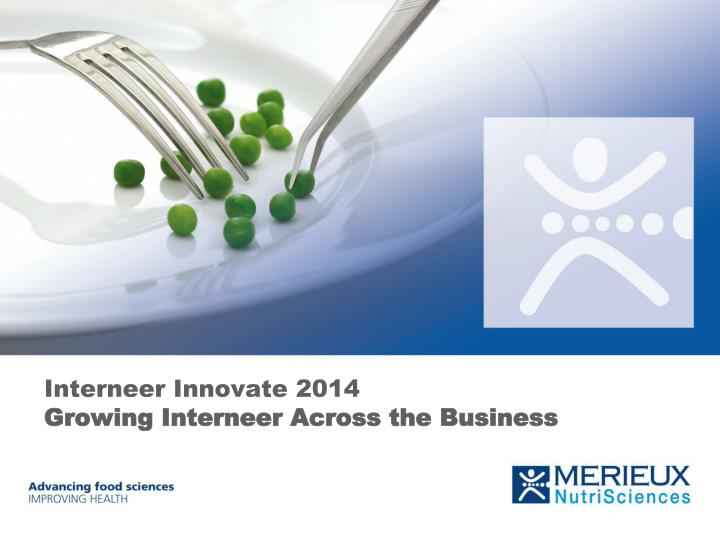
Interneer Innovate 2014Growing Interneer Across the Business
Mérieux NutriSciences • Mérieux Nutrisciences provides laboratory, auditing, consulting, contract research and education services to 7 strategic industries
Mérieux NutriSciences’ development 1990 2007 2011-2013 1967 New « Safari 2012 » Strategy Continuing development Entrepreneurial Phase Building US market leadership • 2011: Silliker Group Corporation is renamed Mérieux NutriSciences Corporation • 2011: China: partnership to create AsiaFoodInspection • 2012: South Africa: Swift acquisition • 2012: Turkey: Chelab acquisition • Geographic expansion continues • Integration of labs in one national network • Quality, ISO accreditation • Solution approach • 1997: Mérieux Groupbecomes shareholder • 1999: Mérieux Group majority share holder, creation of Sillier Group Corporation • Created by Dr. John Silliker in Chicago • Food focused solutions • New management team and Organization • New top line strategic and development plan • Selected external growth to reinforce existing geographies SALES $ 2 Million USD SALES $ 26 Million USD SALES $ 220 Million USD SALES (2013) $ 430 Million USD 2008 1980 2000 2018 « New Globe » Strategy New fields International development US network development • Development in emerging countries • Expansion and partnerships in China, India and Brazil • Diversification in the nutrition field (clinical trials…) • International expansion with 13 acquisitions in Europe and Australia • 3 start-ups in Europe and Australia • Organic growth and M&A opportunities will increase our revenues and profitability • Geographic expansion in the US • 4 new start-ups • Limited laboratory integration SALES $ 10 Million USD SALES $ 300 Million USD
The strength of an international network • Vision: Advancing food sciences, improving health • Mission: Providing services and solutions on a global basis, from food safety and environmental monitoring to research in nutrition 4
THE PROBLEM In 2011, improving the technical competency of our staff #1 priority Technical Training by Quarter Internal Audit Deficiencies for test methods Number of Internal Audit Deficiencies Blue = 2008 data Pink = 2009 data Yellow = 2010 data Document Control Training
THE PROBLEM • WALL OF BINDERS • Each person had a training binder • The longer the person was employed, the bigger the binder – sometimes multiple binders
THE PLAN Expertise Team was formed from members of HROD, Corporate Quality, Industrial Performance, and Laboratory Operations to: Assess technical training processes Implement quick fix remedies where possible Implement new Technical Training methodology at Silliker New methodology and training recommendations were approved and included: Leveraging new technology for employee training Creating a new role at each facility responsible for training
Value Stream Map – before LMS Current Training Process Flow SOP Training Prepare for Quarterly Updates (review, copy, staple) Preparation of Training Binder Orientation Preparation Perform Orientation Schedule and Perform Training. File in binder 1) Read SOPs No Verification of Competency Proof of Competency – 3 points Review and Approval of Completed Training Method Training (Hands on) 193 Hours 172 Hours 800 Hours 224 Hours 275 Hours 1)Read it 2)Observe it 3)Demonstrate it Checklist completed manually 804 Hours 130 Hours Quarterly Safety Training 4400 hrs 26,000 Hours Current Training File Maintenance Review Training Binders for Compliance Determine Who Needs Training and Schedule When. Maintain and Update Training Spreadsheet (Not all Labs Perform) 172 Hours 388 Hours COST = $978,000/year 645 hrs/wk = 16 FTEs
Value Stream Map – After Implementation of LMS New Proposed Training Process Flow SOP Training Preparation of Training Binder Orientation Preparation Perform Orientation Prepare for Quarterly Updates (review, copy, staple) Schedule and Perform Training. File in binder 1) Read SOPs 2) Quiz in Lectora to verify understanding Review and Approval of Completed Training Method Training (Hands on) Proof of Competency – 3 points and Quiz in Lectora Assume 20% time savings. 640 Hours Enter Employee into System 66 Hours 1)Read it 2)Observe it(Hands on or Lectora) 3)Demonstrate it Checklist completed electonically Quarterly Safety Training. Assume 50% reduction - 2200 hrs Sign-off approval in LMS 804 Hours Labor Estimates are Annual 20 Hours Assume 40% Reduction. 15,600 Hours New Training File Maintenance FTE Savings = 6.7 FTEs 370 hrs/week = 9.30 FTEs Review Training Binders for Compliance Determine Who Needs Training and Schedule When. Maintain and Update Training Spreadsheet (Not all Labs Perform) LMS will alert personnel when training is due. Some training can be performed by trainee otherwise it will be coordinated by Training Specialist. LMS = Learning Management System SAVINGS: Over $400,000/year
THE ACTION • Reviewed many “off the shelf” solutions • Typical LMS did not have document control portion • Typical Quality Management software had preset functions that did not match our needs • Expensive to have custom programming • Lots of “modules” that did not apply • “Clunky” look and feel • Made for Quality geeks • INTERNEER to the rescue! • Developed project team • Divided and conquered • Start to Launch in about 6 months
THE SOLUTION Web-based learning management system (SMART) System Management And Relevant Training Distribution & control of quality & training content / documents Assign training tasks Transparent training compliance and audit System to deliver online training courses Online training capabilities New standardized training content Self-study capabilities Integrated proficiency tests Interactive, audio/visual, and video streaming capabilities
SMART –Dashboard Tab • Employee Training • Document Viewer 12
SMART – Employee Tab • Employee Training • Training Courses • Training Schedule • Master List of Job Descriptions 13
SMART – Reports Tab • Employee Reports • Document Reports • Training Reports 14
SMART – Document Tab • Location of Company Documents • SOPs • Methods • Administration Procedures • Forms • Work Instructions • Local Documents • Searchable • Sortable 15
SMART Uses Different Workflow Rules for Different Types of Training • SOP • Methods • Forms • Workshops
SMART System – Activity Metric SMART System went live in April, 2012 for all employees in US & Canada 8,000+ documents and computer-based training courses available In FY13, SMART delivered & documented 88,400 completed training courses
Training Activity in 2013 • Data used to “nudge” labs into completing training • Data used to assist labs lagging behind that did not request assistance.
Need for Improvement • System not optimized when rolled out • Used some existing templates and shoehorned our process into it • In a hurry • We didn’t know what we didn’t know • Suggestions from laboratories on how to improve (I want. . . ) • Time for global roll out
SMART Assessment 2 day system assessment was completed in August 2013. The assessment included: A conference call with some of the end users Discussions with key stake holders Discussed the entire learning management process how it could be improved to simplify the system not only for the users, but for the administrators and developers as well
Implementation Approach & Transition • Design and rebuild a clean slate system focused on: • Ease of maintenance • Ease of change • Scalability • Implement existing SMART modules with enhancements • Implement new features of core SMART system • Transfer existing records and documents • Quality Assurance • Setup requirements management and support process • Review and implement additional processes, i.e. audit tracking
SMART 2.0 Project • SMART 2.0 • NOVEMBER 2013 – MARCH 2014
New Capabilities – Schedule Training • When employee is promoted, the System automatically schedules necessary training courses based upon employee’s new Job Title • System has option for internal training specialist to create pool of “favorite” training courses and use it as a baseline when scheduling training courses • System has option for internal training specialist to add “favorite” job descriptions and use it as a baseline when scheduling training courses 31
New Capabilities in SMART 2.0 • System Configuration & Scalability • User Experience • Reporting & Automation • Stability & Speed
SUMMARY • Easy to use system that is scalable • Duplicated critical parts of our process • Decreased manual labor time required for system maintenance • Increased discipline in completing training • Decreased time spent at laboratories for onsite audits by 25% • Expanding use of database to other processes • Customer complaints • Internal non-conformances • Supplier Qualification and Evaluation • Preventive Actions • Microbiology Method Verification • Internal Audit tracking • Planned Deviations • Expanding use of database to rest of the world