Download
1 / 13
130 likes | 308 Views
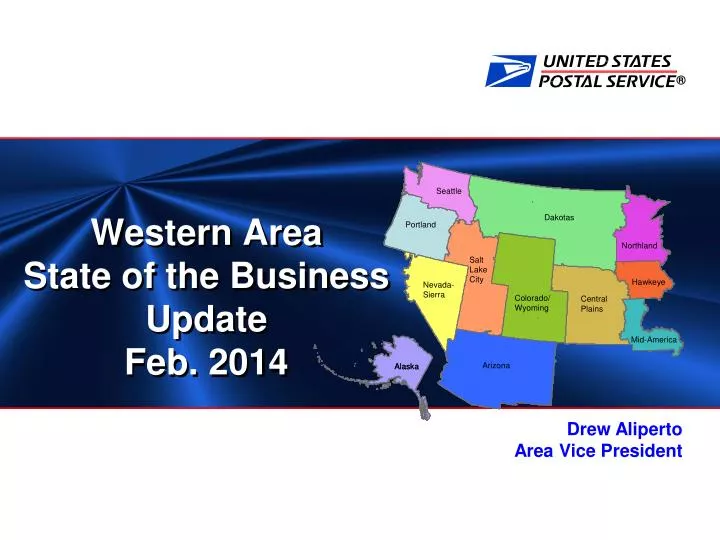
Western Area State of the Business Update Feb. 2014. Drew Aliperto Area Vice President. Who We Are. Drew Aliperto Area Vice President. Who We Are. 18 U.S. states $11.5B operating revenue FY13 30 million delivery points 50+ million customers 2.2 million square miles

E N D
Western Area State of the Business UpdateFeb. 2014 Drew Aliperto Area Vice President
Who We Are Drew Aliperto Area Vice President
Who We Are • 18 U.S. states • $11.5B operating revenue FY13 • 30 million delivery points • 50+ million customers • 2.2 million square miles • 59% of U.S. land mass
Western Area Revenue Western Area FY 2014 Q1 revenue Variance Variance FY 2014 Q1 FY 2013 Q1 (Dollars in millions) $19 $35 $26 $0 $0 $39 Revenue: First-Class Mail Standard Mail Shipping & packages International Periodicals Other $593 $622 $171 $6 $45 $1,733 $574 $657 $145 $6 $45 $1,694 $49 Total Income $3,170 $3,121
Who We Are • For wherever you work, shop, or play, there’s a convenient USPS service location near you in the Western Area: • 101.884 employees • 29K vehicles • 8,421 facilities • 417 facilities with Self-Service Kiosks • 72 Village Post Offices • 785 Contract Postal Units • 329 Community Post Offices • 102 Annexes • 122 Branches • 336 Stations • 6,675 Post Offices (Administrative POs, Main POs, Part-Time POs, Remotely Managed POs) • With 101,884 employees working hard every day to service your mailing needs, you can rest assured that your item will arrive safely and on time at its destination.
A Deep Financial Hole September 2013 • Liabilities exceed assets by approx. $40 billion • The USPS has only 35 cents of assets to cover each dollar of its liabilities ASSETS LIABILITIES * Newly available data on forever stamp usage resulted in a $1.3B reduction in Deferred Revenue – Prepaid Postage
Financial Results • * Before RHB pre-funding and non-cash adjustments to workers’ compensation liabilities. • Retail and Delivery days were equal to FY2013.
Total Revenue FY2013 Q1 vs. FY2014 Q1 +1.9% $ Millions +6.1% +4.2% Volume: + 10.2% +14.1% -4.0% -0.1% Volume: - 2.8% Volume: - 4.6% -2.8%
Operating Expenses * Excludes RHB pre-funding, non-cash adjustments to workers’ compensation liabilities, and separation incentive costs. • Delivery days were equal to FY2013.
Financial Results • * Before RHB pre-funding and non-cash adjustments to workers’ compensation liabilities. • Retail and Delivery days were equal to FY2013.
Thank You! Drew Aliperto Area Vice President