Download
1 / 1
10 likes | 201 Views
Test. TQD (15 mg/kg). Retest. Glc. 0,3. 2,5. [ 18 F]MPPF - BP ND. [ 18 F]FDG. Uptake and Binding of the Serotonin 5-HT 1A Antagonist [ 18 F]-MPPF in Brain of Rats; Effects of the Novel P-glycoprotein Inhibitor Tariquidar.

E N D
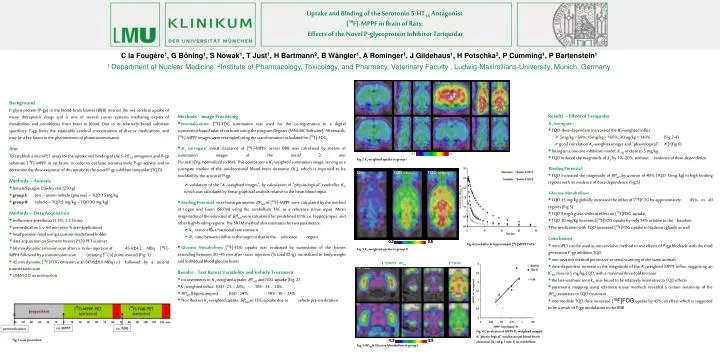
Test TQD (15 mg/kg) Retest Glc 0,3 2,5 [18F]MPPF - BPND [18F]FDG Uptake and Binding of the Serotonin 5-HT1A Antagonist [18F]-MPPF in Brain of Rats; Effects of the Novel P-glycoprotein Inhibitor Tariquidar C la Fougère1, G Böning1, S Nowak1, T Just1, H Bartmann2, B Wängler1, A Rominger1, J Gildehaus1, H Potschka2, P Cumming1, P Bartenstein1 1.Department of Nuclear Medicine, 2Institute of Pharmacology, Toxicology, and Pharmacy, Veterinary Faculty , Ludwig-Maximilians-University, Munich, Germany Results – Effect of Tariquidar K1 surrogate: • TQD-dose-dependent increase of the K1-weighted influx • 5mg/kg = 60%; 15mg/kg = 105%; 30mg/kg = 140% (Fig.2-4) • good correlation K1-weightes images and “physiological” K1) (Fig.6) • fitting on a one-site inhibition model: IC50 of close to 5 mg/kg • TQD reduced the magnitude of k2’ by 10–20%, without evidence of dose-dependence Binding Potential: • TQD increased the magnitude of BPND by a mean of 40% (TQD 15mg/kg) in high binding regions with no evidence of dose dependence (Fig.5) Glucose Metabolism: • TQD 15 mg/kg globally increased the influx of [18F]FDG by approximately 45% in all regions (Fig.5) • TQD 5 mg/kg was without effect on [18F]FDG uptake, • TQD 30 mg/kg increased [18F]FDG uptake by only 14% relative to the baseline • Pre-medication with TQD increased [18F]FDG uptake in Haderian glands as well Conclusion • microPET can be used as non-invasive method to test effects of P-gp blockade with the third generation P-gp inhibitor TQD • non-invasive method permissive to serial scanning of the same animals • dose-dependent increase in the magnitude of the K1-weighted MPPF influx, suggesting an IC50 close to 5 mg/kg TQD, with a maximal three-fold increase • the late washout term k2’ was found to be relatively insensitive to TQD effects • parametric mapping using reference tissue methods revealed a certain sensitivity of the BPNDestimates to TQD treatment • intermediate TQD dose increased [18F]FDG uptake by 45%, an effect which is suggested to be a result of P-gp modulation in the BBB • Background • P-glyco-protein (P-gp) in the blood-brain barrier (BBB) restricts the net cerebral uptake of many therapeutic drugs and is one of several carrier systems mediating export of metabolites and xenobiotics from brain to blood. Due to its relatively broad substrate specificity, P-gp limits the attainable cerebral concentration of diverse medications, and may be a key factor in the phenomenon of pharmacoresistance. • Aim • To establish a microPET assay for the uptake and binding of the 5-HT1A antagonist and P-gp substrate [18F]-MPPF in rat brain, in order to evaluate noninvasively P-gp activity and to determine the dose-response of this uptake to the novel P-gp inhibitor tariquidar (TQD). • Methods – Animals • female Sprague Dawley rats (250 g) • group I: test – retest- vehicle (glucose) – TQD 15 mg/kg • group II: vehicle – TQD 5 mg/kg – TQD 30 mg/kg) • Methods – Data Acquisition • isofluorane anesthesia (1.5%, 1.2 l/min) • premedication (i.v. 60 min prior Tracer-application) • head position fixed using a custom-made head holder • data acquisition on Siemens Inveon P120 PET scanner • 60 min dynamic emission scan after i.v. bolus injection of 45.6±4.2 MBq [18F]-MPPF followed by a transmission scan (rotating [57Co] point-source) (Fig. 1) • 45 min dynamic [18F]-FDG emission scan (47.6±6.0 MBq i.v.) followed by a second transmission scan • OSEM-2D reconstruction Methods - Image Processing • Normalization: [18F]-FDG summation was used for the co-registration to a digital cryosection-based atlas of rat brain using the program Register (MNI-BIC Software). Afterwards, [18F]-MPPF images were resampled using the transformation calculated for [18F]-FDG. • K1 surrogate: initial clearance of [18F]-MPPF across BBB was calculated by means of summation images of the initial 2 min (% total ID/g, normalized to BW). This constitutes a K1-weighted summation image, serving as a surrogate marker of the unidirectional blood-brain clearance (K1), which is expected to be modified by the action of P-gp. • validation of the “K1-weighted images”, by calculation of “physio-logical” cerebellar K1, which was calculated by linear graphical analysis relative to the heart blood input. • Binding Potential: voxel-wise parametric BPND of [18F]-MPPF were calculated by the method of Logan and Gunn (SRTM) using the cerebellum TAC as a reference tissue input. Mean magnitudes of the estimates of BPND were calculated for predefined VOIs, i.e. hippocampus, and other high-binding regions. The SRTM method also estimates the two parameters: • k2’: tracer efflux fractional rate constant • R1: ratio between influx in the target to that in the reference region • Glucose Metabolism: [18F]-FDG uptake was evaluated by summation of the frames extending between 30–45 min after tracer injection (% total ID/g), normalized to body weight and individual blood glucose levels Results - Test Retest Variability and Vehicle Treatment • no asymmetry in K1-weighted uptake, BPND and FDG-uptake (Fig. 2) • K1-weighted influx: RSD : 21 – 28%; TRV : 14 – 28% • BPND (Hippocampus) RSD : 24%; TRV : 18 – 24% • No effect on K1-weighted uptake, BPND or FDG-uptake due to vehicle pre-medication Fig.2 K1-weighted uptake in group I Fig.4 Cerebellar & hippocampal [18F]MPPF TACä Fig.3 K1-weighted uptake in group II Fig. 6 Correlation of MPPF K1-weighted imaged & “physio-logical” unidirectional blood-brain clearance (K1; ml g-1 min-1) in cerebellum Fig.1 scan procedure Fig. 5 BPND &Glucose Metabolismin group I