Download
1 / 10
100 likes | 230 Views
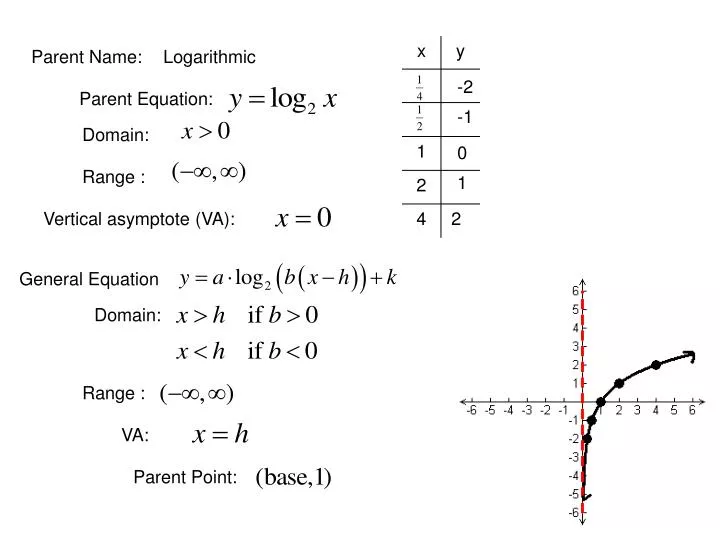
Parent Name: . Logarithmic. -2. Parent Equation: . -1. Domain: . 0. Range : . 1. Vertical asymptote (VA): . 2. General Equation . Domain: . Range : . VA: . Parent Point:. Review of Transformations. a.

E N D
Parent Name: Logarithmic -2 Parent Equation: -1 Domain: 0 Range : 1 Vertical asymptote (VA): 2 General Equation Domain: Range : VA: Parent Point:
Review of Transformations a Reflects across the x-axis Shrinks by a Stretches by a b Reflects across the y-axis h positive h Right h spaces Left h spaces negative h k positive k Up k spaces negative k Down k spaces
Steps for Graphing Logarithmic Functions 1) State the transformations 2) State the Domain and Range. 3) Find the vertical asymptote and then sketch it. 4) Look at your asymptote and think about the domain, will the graph cross the y-axis? If so, find the y-intercept and plot it. If not, there is no y-intercept. 5) Find and plot the x-intercept. (There will always be one.) 6) State the parent point. 7) Put an x on the graph for the parent point and then perform the transformations on this one point. 8) Sketch the graph.
Transformations: Domain: Range: VA: x-int: y-int: P.P.
Transformations: Domain: Range: VA: x-int: y-int: P.P.
Transformations: Domain: Range: VA: x-int: y-int: P.P.
Transformations: Domain: Range: VA: x-int: y-int: P.P.
Transformations: Domain: Range: VA: x-int: y-int: P.P.
Transformations: Domain: Range: VA: x-int: y-int: P.P.