Download
1 / 17
170 likes | 462 Views
Population Changes. Distribution Patterns are Fluid. Distribution Patterns are Fluid. For each population, the distribution pattern is a product of complex interactions between behaviours and other characteristics that increase each individuals chances of reproduction and survival.

E N D
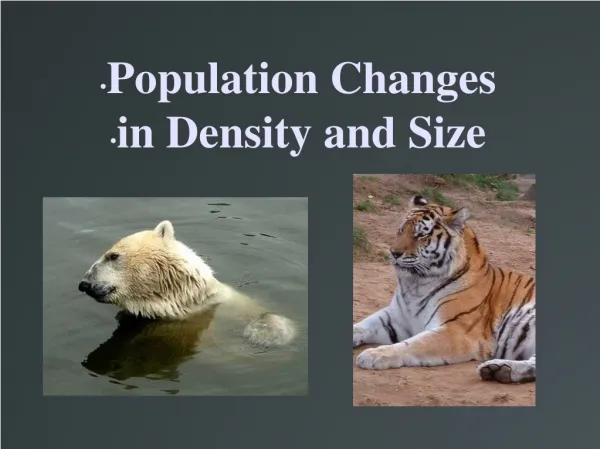
Population Changes Distribution Patterns are Fluid
Distribution Patterns are Fluid • For each population, the distribution pattern is a product of complex interactions between behaviours and other characteristics that increase each individuals chances of reproduction and survival • http://www.appinsys.com/globalwarming/GW_4CE_Animals.htm http://www.rarwriter.com /PublicPolicyandPolitics_2.htm
Review of Distributionhttp://roadtravelafrica.com/2010/11/26/meerkats/ http://blog.webosaurs.com/2011/02/09/wolverines-disappearing-from-the-us/ Ex. #2 Wolverines – territorial in an area with evenly distributed food Ex. #3 Tropical Fig – seeds are randomly distributed in tropical rain forests ** this type of distribution is very rare Ex. #1 Meerkats – live in groups gathered near resources
Immigration, Emigration, Natality & Mortality ΔN = [B+I]- [D+E] How Populations Change Size
Immigration vs Emigration Immigration Emigration The movement of individuals out of a population • The movement of individuals into a population • For most species immigration/emigration has little impact on population size • Exception include human populations (we move more than is typical for a species) and invasive species such as zebra mussels • Open populations have immigration/emigration, • closed populations do not! • http://www.cloca.com/lwc/streams_invasive.php • http://www.awdalpress.com/index/?attachment_id=15131
Natalityvs Mortality Natality Mortality Death http://www.treehugger.com/natural-sciences/forest-death-rates-doubled-on-the-west-coast.html • Birth • http://favim.com/image/68983/ • As the population density increases, birth rates often decrease and death rates typically increase • Since most populations are not greatly effected by immigration/emigration: • ΔN = B-D EX. In a population of slow loris, 24 were born • Δ → change and3 died the population size is: • N → population size • B → births ΔN = B-D ΔN = 24 - 3 • D → Deaths ΔN = 21
Aspects of Natality Fecundity, Survivorship, r- and k- selected strategies
Fecundity • The average number of offspring produced by a female over her lifetime • This tends to be inversely related to the amount of care a parent provides • Ex. Turtles have a high fecundity, while gorilla’s have low fecundity http://www.chinadaily.com.cn/photo/2007-09/22/content_6126743_4.htm http://scienceblogs.com/zooillogix/2008/08/05/are-you-hiding-125000-western/
Survivorship • The number or percentage of organisms that typically live to a certain age in a given population • Type I shows a high rate of rate of juvenile survival and individuals that live to sexual maturity and beyond EX. Humans • Type II shows a constant risk of mortality throughout an individuals lifetime EX. squirrels • Type III most individuals die as juveniles, only a few live long enough to produce offspring, and fewer live to old age EX. oysters • http://mycozynook.com/102RGCh36OH.htm
r- and k- selected Strategies r- selected strategy K- selected strategy Live a relatively long life span Become sexually mature later in life Produce few offspring per reproductive cycle Provide a high level of parental care • Short life span • Become sexually mature at a young age • Produce large broods of offspring • Provide little or no parental care to their offspring • Most populations fall somewhere between these two strategies • Describing if a population is r-selected or k-selected requires that it be compared to another population
Population Growth Models Unlimited and Limited Environments
Biotic Potential • The highest possible per capita growth rate for a population • AKA intrinsic rate of natural increase (r) • A species’ biotic potential is related to its fecundity • http://www.underwater.org/mermaid/tanzania/underwater3.html
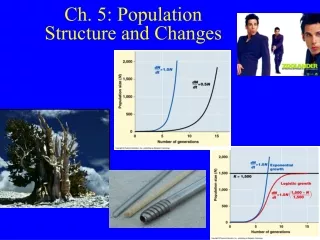
Unlimited Environment Exponential Growth Model Geometric Growth Model Deaths can occur throughout the year, but births are restricted to a breeding season Sampling occurs on a yearly (usually) basis • Births and deaths can occur throughout the year, (no fixed breeding season) • Sampling can be continuous EX. Humans EX. Sparrows
J-shaped Growth Curve • This graph traditionally represents exponential growth • At the bottom there is a lag phase followed by an exponential growth phase
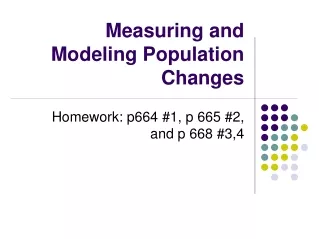
Limited Environments: Carrying Capacity • Carrying capacity is the maximum population size that a habitat can sustain over an extended period of time • At this point the birth and death rates are approximately equal • http://www.hunter-ed.com/az/course/ch9_carrying_capacity.htm
Limited Environments: Logistic Growth • Logistic Growth is the growth pattern exhibited by a population for which growth is limited by carrying capacity, or limited availability of resources • Populations that achieve logistic growth are represented by a sigmoidal or s-shaped curve • http://gcevoices.com/ep/2012/02/10/using-logic-for-problem-solving/