Download
1 / 27

E N D
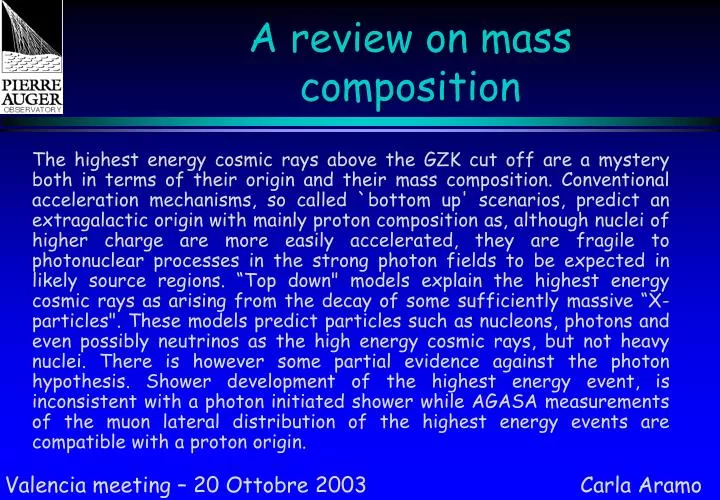
A review on mass composition The highest energy cosmic rays above the GZK cut off are a mystery both in terms of their origin and their mass composition. Conventional acceleration mechanisms, so called `bottom up' scenarios, predict an extragalactic origin with mainly proton composition as, although nuclei of higher charge are more easily accelerated, they are fragile to photonuclear processes in the strong photon fields to be expected in likely source regions. “Top down" models explain the highest energy cosmic rays as arising from the decay of some sufficiently massive “X-particles". These models predict particles such as nucleons, photons and even possibly neutrinos as the high energy cosmic rays, but not heavy nuclei. There is however some partial evidence against the photon hypothesis. Shower development of the highest energy event, is inconsistent with a photon initiated shower while AGASA measurements of the muon lateral distribution of the highest energy events are compatible with a proton origin. Valencia meeting – 20 Ottobre 2003 Carla Aramo
Lo spettro dei raggi cosmici • The CR energy spectrum above 109 • eV can be described by a series of • power laws, with the fux falling • about 3 orders of magnitude for • each decade increase in energy. In • the decade centered at 5x10¹⁵ eV • (the knee) the spectrum steepens • from E-2.7 a E-3.0 . • This feature, discovered around 40 • years ago is still not consistently • explained. • The spectrum steepens further to • E-3.3 above 7x10¹⁷ eV eV and then • flattens to E-2.7 at 5x10¹⁸ eV (the ankle).
Parametri misurati Nmax Xmax Ne Xo
Analisi in Ne- Nm (1) E = 1018 eV, q = 0o
Elongation rate The rate of change of Xmax with the log of the energy of the primary, dXmax/dlog(E), is known as the elongation rate Gap – 2003-029 Roma2
Kascade • Parametri misurati: • Componente elettromagnetica (Ne) • Componente muonica (Nm ) • Componente adronica (Nh)
Haverah Park • The HP extensive air shower array • was situated near Leeds, UK, at an • altitude of 220 m asl. • Particles were detected with water • Cherenkov counters of approximately • 2.29 m2 area 1.2 m depth, viewed by a • Photomultiplier tube (PMT). • The number of Cherenkov photons • released in a water tank is proportional • to the energy deposit of the shower • particles in the water.
Sviluppo laterale • La distribuzione di densità laterale del segnale Cherenkov in funzione della distanza dall’asse dello sciame è parametrizzata dalla “funzione di distribuzione laterale”: • dove f e k dipendono dal rivelatore e h dall’angolo di incidenza e dall’energia del primario. • Per r> 800 m questa formula empirica deve essere modificata introducendo il fattore (r/800)1.03
AGASA This array is called the Akeno Giant Air Shower Array (AGASA) . AGASA covers an area of about 100 km2 and consists of 111 detectors on the ground (surface detectors) and 27 detectors under absorbers (muon detectors). Each surface detector is placed with a nearest-neighbor separation of about 1 km and the detectors are sequentially connected with a pair of optical fibers. All detectors are controlled and operated by a set of commands transmitted from a central computer.
Sviluppo laterale in AGASA • dove: rM raggio di Molière • (91.6 m per Akeno) • Cfattore di normalizzazione • a = 1.2, d = 0.6 • S0 (600) è la densiyà di • Particelle cariche in 1/m2 a • 600 m dal core per sciami • verticali
Sciame da 2x10²⁰ eV rivelato da AGASA I cerchi sono le densità delle particelle rivelate, il cui raggio corrisponde al logaritmo della densità Distribuzione laterale
Mass composition from AGASA • Data from the AGASA array (muon • threshold of 0.5GeV) . • Sold lines and triangles show • simulations from MOCCA+SIBYLL • for iron (top) and proton (bottom) • primary particles.
Fly's Eye Detector Parameters Fly's Eye Detector Parameters Fly’s eye Number of mirrors 67 Diameter of mirrors 1.575 m Focal Length 1.500 m Number of PMT 880 Mirror Obscuration by PMT cluster 13% Mirror-cone efficiency product ~0.7 PMT type EMI 9861 B Peak PMT quantum efficiency at 360 nm 0.21 Angular Aperture per PMT 91.5 mr Solid Angle per PMT 6.57 msr Number of electronic channels 2640 Charge dynamic range 105 linear Time Resolution 25 ns
Sviluppo longitudinale (Fly’s eye) • Profilo longitudinale di uno sciame innescato da un particella primaria di 3x10²⁰eV
HIRES • It uses 14 spherical • telescopes of d= 2.0m to • collect the light from a • 0.95 sr portion of the • sky. The image plane of • each telescope is • populated with an array • of 256 hexagonal PMTs, • yielding pixel of 1o. In • monocular mode, the • effective acceptance of • this instrument is 350 • (1000) km2 sr at 1019 • (1020) eV, on average • about 6 times the Fly's • Eye acceptance, and the • threshold energy is 1017 eV.
Reconstructed event with Hires • Display of an Event with • reconstructed energy of 52 EeV. • The upper left part of this figure • shows the four mirrors that • triggered for this event. • The upper right panel shows the • azimuthal vs. elevation angles of • triggered tubes, with a fit • superimposed. The lower left panel • shows the time of the tube hits in • FADC time slices vs. the angle of • the tube measured along the track, • with two ts superimposed: a straight • line and the result of the time t. • The lower right quarter shows the • number of charged particles in the • shower as a function of slant depth • (in g/cm2), with the fit to the • Gaisser-Hillas formula superimposed.
Confronto sullo spettro 15/8/2002 • The result is consistent with the flux measured by the Fly's Eye experiment using • the stereo reconstruction technique. Above 1020eV the Hires data is significantly • different from that of the AGASA experiment. The data are fitted with a model • incorporating both galactic and extragalactic sources of cosmic rays, which • includes the GZK cutoff, and find a good agreement. 2/10/2003
Energy spectrum 6/12/2002 • A composite energy spectrum • including recently reanalysed • Haverah Park data assuming • proton and iron primaries • (the parameter measures the • Attenuation length of the • density of charged particles • at 600 m from the shower • core), stereo Fly's Eye data, • Monocular HiRes data from • both eyes up to 60, and • Hybrid HiRes MIA data.