Download

1 / 95
1.08k likes | 2k Views
Lot-by-Lot Acceptance Sampling for Attributes. An Operating Characteristic (OC) Curve Showing Risks. 100 95 75 50 25 10 0. = 0.05 producer’s risk for AQL. Probability of Acceptance. = 0.10. Percent Defective. Consumer’s risk for LTPD.

E N D
Lot-by-Lot Acceptance Sampling for Attributes Introduction to Statistical Quality Control, 4th Edition
An Operating Characteristic (OC) Curve Showing Risks 100 95 75 50 25 10 0 = 0.05 producer’s risk for AQL Probability of Acceptance = 0.10 Percent Defective Consumer’s risk for LTPD 0 1 2 3 4 5 6 7 8 AQL LTPD Good lots Bad lots Indifference zone
Acceptance Sampling Procedure Lot received Sample selected Sampled items inspected for quality Results compared with specified quality characteristics Quality is not satisfactory Quality is satisfactory Reject the lot Accept the lot Decide on disposition of the lot Send to production or customer
A Two-Stage Acceptance Sampling Plan First Stage Inspect n1 items Find x1 defective items in this sample Yes Accept the lot x1<c1 ? No Yes Reject the lot x1>c2 ? Second Stage No Inspect n2 additional items Find x2 defective items in this sample Yes No x1 + x2<c3 ?
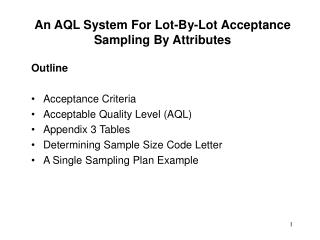
The Acceptance-Sampling Problem • Acceptance sampling (SamplingPenerimaan ) berkaitan dengan pemeriksaan dan pengambilan keputusan tentang produk.
Three aspects of sampling • Tujuan sampling penerimaan adalah untuk memutuskanditerima / ditolak lot, tidak untuk memperkirakan kualitas lot • Meskipun, beberapa rencana melakukan ini • SamplingPenerimaan bukan kontrol kualitas • Hanya menolak atau menerima lot • Bahkan jika lot mempunyai kualitas yang sama, sampling akan menerima beberapa lot dan menolak lot lain
Three aspects of sampling • Kualitastidakbisadiperiksakedalamproduk • Penerimaan sampling adalahalat audit yang menjaminbahwa output dariprosessesuaidenganpersyaratan
The Acceptance-Sampling Problem • Tiga pendekatan untuk pengambilankeputusanthd lot: • Terima dengan tanpainspeksi • 100% inspeksi • Sampling Penerimaan
14-1. The Acceptance-Sampling Problem Mengapa Penerimaan Sampling dan Tidak Inspeksi 100%? • Pengujian dapat merusak (destruktif) • Biaya inspeksi 100% tinggi • 100 inspeksi% tidak layak • Membutuhkan terlalu banyak waktu • Bisa tidak akurat • Jika vendor memiliki sejarah kualitas yang sangat baik Introduction to Statistical Quality Control, 4th Edition
The Acceptance-Sampling Problem Keuntungan dan Kerugian dari Sampling Keuntungan • Mengurangi kerusakan • Mengurangi jumlah kesalahan inspeksi Kekurangan • Risiko menerima lot "buruk”, menolak produk "baik” • Kurang (sedikit) informasi yang dihasilkan • Memerlukan perencanaan dan dokumentasi Introduction to Statistical Quality Control, 4th Edition
Statistical Sampling--Data • Attribute (Go no-go information) • Barang cacat - mengacu pada keberterimaan produk di berbagai karakteristik. • Cacat - mengacu pada jumlah cacat per unit - mungkin lebih tinggi dari jumlah barang cacat. • Variable (Continuous) • Biasanya diukur dengan rata-rata dan standar deviasi.
SamplingPenerimaan Atribut Jenis Rencana Sampling • Single sampling plan • Double-sampling plan • Multiple-sampling plan • Sequential-sampling Introduction to Statistical Quality Control, 4th Edition
14-1. The Acceptance-Sampling Problem 14-1.3 Lot Formation • Considerations before inspection: • Lots should be homogeneous • Produced by the same machine, same operators, common raw materials, approximately the same time Introduction to Statistical Quality Control, 4th Edition
The Acceptance-Sampling Problem Lot Formation • Pertimbangan sebelum pemeriksaan: • Lot Lebih besar lebih disukai dari lot kecil • Lebih ekonomis • Lot-lot harus sesuai dengan fasilitas yang digunakan dalam sistem penanganan material baik di vendor dan konsumen. Introduction to Statistical Quality Control, 4th Edition
The Acceptance-Sampling Problem Random Sampling • Unit yang dipilih untuk inspeksi harus dipilih secara acak. • Jika sampel acak tidak digunakan, bias dapat terjadi • Jika ada metode penilaian yang digunakan untuk memilih sampel, statistik dasar dari prosedur penerimaan-sampling jadi hilang. Introduction to Statistical Quality Control, 4th Edition
Non-randomization • Pilih unit dari lapisan atas setiap kotak Introduction to Statistical Quality Control, 4th Edition
Randomization • Contoh: Menetapkan nomor ke setiap unit di di dalam lot1, 2, ..., N • Pilih n nomor unik acak dari 1, 2, ..., N • Nomor yang dipilih merupakan sampel Introduction to Statistical Quality Control, 4th Edition
Single-Sampling Plans For Attributes Definisi Rencana Sampling Tunggal • Sebuah rencana sampling tunggal didefinisikan oleh ukuran sampel, n, dan jumlah penerimaan c. Katakanlah ada N item total dalam satu lot. Pilih n dari item secara acak. Jika lebih dari c item yang tidak dapat diterima, menolak Lot. • N = ukuran lot • n = ukuran sampel • c = jumlah penerimaan • d = jumlah barang cacat yang diamati • Penerimaan atau penolakan lot didasarkan pada hasil dari sampel tunggal Introduction to Statistical Quality Control, 4th Edition
Example • N = 10000, n = 89, c = 2 • Dari lot brukuran 10,000, ambil sampel dengan ukuran 89 • Amati jumlah barang cacat, d • jika d < 2, terima lot • Jika tidak, tolak lot Introduction to Statistical Quality Control, 4th Edition
Single-Sampling Plans For Attributes The OC Curve (Kurva Karakteristik Operasi) • The operating-characteristic (OC) curvemengukur kinerja rencana penerimaan-sampling • The OC curve plots the probability of accepting the lot versus the lot fraction defective. • The OC curve shows the probability that a lot submitted with a certain fraction defective will be either accepted or rejected. Introduction to Statistical Quality Control, 4th Edition
DESIGNING THE PLAN • Acceptable Quality Level (AQL) = Persentase Maks barang cacat yg diterima didefinisikan oleh produser. • (Risiko Produser) = Probabilitas menolak lot yang baik. • Limiting Quality Level (LQL) = Lot Tolerance Percent Defective (LTPD) = Persentase barang cacat yang mendefinisikan titik penolakan konsumen. • (Risiko Konsumen) = Probabilitas menerima lot buruk.
a AQL LTPD
1 0.9 = .05 (producer’s risk) 0.8 0.7 n = 99 c = 4 0.6 0.5 Probability of acceptance 0.4 =.10 (consumer’s risk) 0.3 0.2 0.1 0 1 2 3 4 5 6 7 8 9 10 11 12 AQL LTPD Percent defective Operating Characteristic Curve
The OC Curve • Why is OC Curve So Important? • It Provides Trade-Offs between, N, n, c, AQL, , LTPD, and . • The Resulting OC Curve should achieve the desired characteristics for producer and consumer. • Study the previous OC Curve or Fig. 10-2 versus the Ideal of Figure 10-1.
THE OPERATING-CHARACTERISTIC (OC) CURVE • Untuk sebuah rencana sampling dan diberikan fraksi rusak p, kita dapat menghitungPa -- Probabilitas menerima lot • Jika lot benar-benar baik 1 - Pa = a • Jika lot benar-benar buruk Pa = b • plot dari Pasebagai fungsi dari p disbut sebagai kurva OC untuk rencana sampling yg diberikan OPS 465 - Qual Mgmt
THE OPERATING-CHARACTERISTIC (OC) CURVE • Rencana pengambilan contoh yang ideal sempurna membedakan antara pengiriman baik dan burukBaik a dan b adalah nol pada contoh ini!Hal ini membutuhkan ukuran sampel sama dengan populasi - tidak layak OPS 465 - Qual Mgmt
CONSTRUCTING AN (OC) CURVE • Untuk rencana sampling yang ditentukan tunggal, kurva OC dapat dibangun menggunakan distribusi binomial jika n adalah relatif kecil terhadap ukuran lot • p - fraksi yg tidak sesuain - ukuran sampelc - jumlah penerimaan Excel OPS 465 - Qual Mgmt
CONSTRUCTING AN (OC) CURVE • Misalkan kita memiliki rencana sampling didefinisikan oleh parameter berikut:n = 100c = 2Berapa probabilitas menerima lot dengan barang cacat 0,5%? OPS 465 - Qual Mgmt
CONSTRUCTING AN (OC) CURVE OPS 465 - Qual Mgmt
USING AN (OC) CURVE • How do we find a and b using an OC curve? • AQL = 0.01 • LTPD = 0.05 • Then a = 1 – Pa(p=0.01) = 1 - 0.9206 = 0.0794 • And b = Pa(p=0.05) = 0.1183 OPS 465 - Qual Mgmt
AVERAGE OUTGOING QUALITY • Pertimbangkan bagian dengan fraksi jangka panjang tidak sesuai p • Sampel ukuran n diambil dari lot ukuran N dan diperiksa • Setiap barang cacat dalam sampel ukuran n diganti, menerima atau menolak • Ketika lot diterima, kita berharap p (N-n) barang cacat dalam sisa lot • Ketika lot ditolak, maka akan diurutkan dan unit rusak diganti, meninggalkan N-n unit baik di sisanya • Hal ini disebut sebagai "meluruskan" inspeksi OPS 465 - Qual Mgmt
AVERAGE OUTGOING QUALITY • Jika Paadalah probabilitas menerima lot, maka rata-rata kualitas keluar : • The worst possible AOQ is the AOQ Limit or AOQL Excel OPS 465 - Qual Mgmt
Example • See Fig. 14-2 on pg. 683 and discussion following • If p = .01, Pa = .9397 • See computation at bottom of pg. 683 • See Table 14-2 • If p = .02, Pa = .7366 means that 73.66% of lots will be accepted and 26.34% will be rejected Introduction to Statistical Quality Control, 4th Edition
Effect of n and c on OC curves • Fig. 14-3, ideal OC curve • Pa = 1.0 until a level of quality that is considered ‘bad’ is reached Introduction to Statistical Quality Control, 4th Edition
Effect of n and c on OC curves • Fig. 14-4, OC curve for different values of n • By increasing the sample size, we get closer to the ideal OC curve Introduction to Statistical Quality Control, 4th Edition
Effect of n and c on OC curves • Fig. 14-5, OC curve for different values of c • As c is decreased, the OC curve shifts to the left • When c = 0, it is very hard on the vendor Introduction to Statistical Quality Control, 4th Edition
14-2. Single-Sampling Plans For Attributes 14-2.3 Designing a Single-Sampling Plan with a Specified OC Curve • probabilitas penerimaan yang 1 - untuk lot dengan fraksi cacat p1. • probabilitas penerimaan yang untuk lot dengan fraksi cacat p2. • Asumsikan sampling binomial adalah tepat • Untuk tipe B kurva OC (dari lot besar) Introduction to Statistical Quality Control, 4th Edition
Binomial Probability Function for Acceptance Sampling Probability of Accepting a Lot (Pa) where: n = sample size p = proportion of defective items in lot x = number of defective items in sample f(x) = probability of x defective items in sample
Pa = P (d ≤ c) Pa = ∑ n! Pd (1-p) n-d d! (n-d)! Nilai Pa terlihatpadaTabelDISTRIBUSI BINOMIAL NRC PGi
14-2. Single-Sampling Plans For Attributes 14-2.3 Designing a Single-Sampling Plan with a Specified OC Curve • Ukuran sampel n and jumlah penerimaancSolusi menjadi : Introduction to Statistical Quality Control, 4th Edition
14-2. Single-Sampling Plans For Attributes Contoh • Pertimbangkan membangun rencana sampling dimana • p1 = 0.01 • = 0.05 • p2 = 0.06 • = 0.10 • N = 1000 • Menggunakan perangkat lunak komputer atau pendekatan grafis (menggunakan nomograph binomial sesuai) dapat ditunjukkan bahwa nilai yang diperlukan n dan c adalah 85 dan 2, masing-masing. Introduction to Statistical Quality Control, 4th Edition
Using the nomograph • Tarik garis dari p1 = .01 pada sisi kiri ke (1–a ) = .95 pada sisi kanan • Tarik garis kedua dari p2 = .06 pada sisi kiri ke b = .10 pada sebelah kanan • Perpotongan dua garis mendefinisikan rencana n = 89, c = 2 Introduction to Statistical Quality Control, 4th Edition
Using the nomograph • Figure 14-9 • Karena n dan c harusberupa integer, prosedurinisebenarnyaakanmenghasilkanbeberaparencana yang telahkurva OC yang lolosdekatdenganrencana yang diinginkan • Holding the first line constant, and holding p2, two plans are observed, with values of b different than desired, one lower and the other higher Introduction to Statistical Quality Control, 4th Edition
Using the nomograph • Figure 14-9 • Holding the second line constant, and holding p1, two plans are observed, with values of a different than desired, one lower and the other higher Introduction to Statistical Quality Control, 4th Edition
Rectifying inspection • Memerlukan tindakan korektif ketika lot ditolak • 100% penyaringan pada lot ditolak • item Rusak dihapus • Mempengaruhi kualitas keluar Introduction to Statistical Quality Control, 4th Edition