Download
1 / 31
530 likes | 1.45k Views
The thermodynamics of phase transformations. Robin Perry School of Physics and Astronomy, Edinburgh. Introduction to Computer Simulation of Alloys meeting 4 th May 2010. Preamble: phase diagrams of metal alloys. Contents. Preamble: phase diagrams of metal alloys

E N D
The thermodynamics of phase transformations Robin Perry School of Physics and Astronomy, Edinburgh Introduction to Computer Simulation of Alloys meeting 4th May 2010
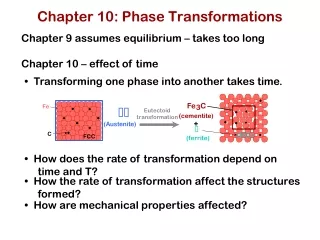
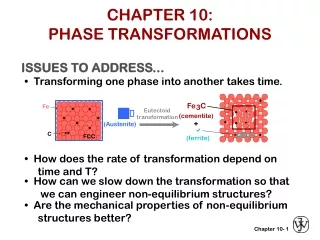
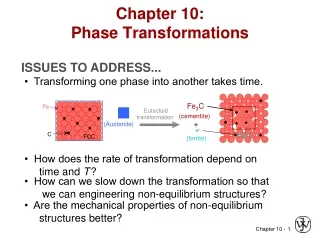
Contents • Preamble: phase diagrams of metal alloys • Gibbs free energy, equilibrium and chemical potential, Gibbs phase rule • Single component systems • dG(T) • Clausius-Clapeyron equation and the phase diagram of titanium • Binary (two component) systems • Ideal solutions • Regular solutions • Activity • Real solutions, ordered phases and Intermediate phases • Binary phase diagrams • Miscibility gap • Ordered alloys • Eutectics and peritectics • Additional useful relationships • Ternary diagrams • Kinetics of Phase transformations
2. Gibbs free energy, equilibrium and chemical potential, Gibbs phase rule Definition of terms : Phase, K: portion of the system with homogeneous properties and composition. Physically distinct. Components, C : chemical compounds that make up a system Gibbs free energy, G (J/mol): measure of relative stability of a phase at constant temperature and pressure G = E + PV TS + N Intensive variables : Temperature, T (K); Pressure, P (Pa); Extensive variables : Internal energy E (J/mol); Volume, V (m3), Entropy (J/K mol) particle number, N;Chemical potential (J/mol) Solids/liquid transitions in metals: PV small ignore
2. Gibbs free energy, equilibrium and chemical potential, Gibbs phase rule Equilibrium : the most stable state defined by lowest possible G dG = 0 metastable equilibrium E.g. Metastable : Diamond Equilibrium : Graphite Solid : Low atomic kinetic energy or E low T and small S Liquid : Large E high T and large S Chemical potential or partial molar free energy governs how the free energy changes with respect to the addition/subtraction of atoms. This is particularly important in alloy or binary systems.(particle numbers will change)
2. Gibbs free energy, equilibrium and chemical potential, Gibbs phase rule Gibbs phase rule for equilibrium phase : Number of degrees of freedom F = C – K +2 Examples : Single component system C=1 and F = 3 K If 1 phases in equilibrium (e.g. solid) 2 degrees of freedom i.e. can change T and P without changing the phase If 2 phases in equilibrium (e.g. solid and liquid) 1 degree of freedom i.e. T is dependent on P (or vice-versa) If 3 phases in equilibrium (e.g. solid, liquid and ) 0 degrees of freedom. 3 phases exist only at one fixed T and P. C, number of components K, number of phases in equilibrium
3. Single component systems For purposes of most discussions : fix pressure (unless otherwise stated) G From thermodynamics:Sliquid >Ssolid Gsolid Phase transition occurs when: Gsolid=Gliquid Gliquid TM T (K) For pressure dependence: Similar arguments apply : Vliquid > Vsolid so increasing P implies liquid to solid transition Assumption: Closed system ignore d
Clausius Clapeyron Equation more dense (intermediate) more dense Less dense Less dense
Binary (two component) systems : Ideal solutions G1 = XAGA + XBGB Two species in the mixture: consider mole fractions XA and XB XA + XB = 1 • Two contributions to G from mixing two components together: • G1 – weighted molar average of the two components • Free Energy of mixing GMIX = Hmix - T SMIX Where Hmix is the heat absorbed or evolved during mixing or heat of solution SMIX is the entropy difference between the mixed and unmixed states
Binary (two component) systems : Ideal solutions Boltzmann equation: S = kB ln ( ) S is the configurational entropy - total number of microstates of system or total number of distinguishable ways of arranging the atoms Mixing components lowers the free energy! Simplest case : Ideal solution : HMIX = 0 • Some assumptions : • Free energy change is only due to entropy • Species A and B have the same crystal structure (no volume change) • A and B mix to form substitutional solid solution Using Stirling’s approximation and NakB=R Molar Free Energy GMIX = RT(XAlnXA + XBlnXB)
Binary (two component) systems : The chemical potential Chemical potential : governs the response of the system to adding component Two component system need to consider partial molarA and B. Total molar Gibbs free energy = SdT + AXA + BXB (+VdP) Simplified equations for an ideal liquid: AXA = GA +RTlnXA BXB = GB +RTlnXB I.e. Ais the free energy of component A in the mixture
Binary (two component) systems : Regular solutions and atomic bonding Generally: HMIX0 i.e. internal energy of the system must be considered In a binary, 3 types of bonds: A-A, B-B, A-B of energies AA, BB, AB = AB ½(AA +BB) Define: HMIX= CAB where CAB is the number of A-B bonds and HMIX= XAXB Where =Naz, z=bonds per atom If <0 A-B bonding preferred If >0 AA, BB bonding preferred GMIX = HMIX + RT(XAlnXA + XBlnXB) Point of note: GMIX always decreases on addition of solute
Free energy curves for various conditions: Mixing if A and B atoms bond Mixing always occurs at high Temp. despite bonding A and B atoms repel Phase separation in to 2 phases.
Binary (two component) systems :Activity, a of a component GMIX -RTln aB -RTln aA B A 0 1 XB Activity is simply related to chemical potential by: GB A = GA + RT ln aA GA B = GB + RT ln aB It is another means of describing the state of the system. Low activity means that the atoms are reluctant to leave the solution (which implies, for example, a low vapour pressure). i.e. For homogeneous mixing, <0 aA<XA and aB<XB So the activity is the tendency of a component to leave solution
For low concentrations of B (XB<<1) Henry’s Law (or everything dissolves) And… Raoult’s Law HMIX > 0 HMIX < 0 Homogeneous mixing
Binary phase diagrams : The Lever rule Temperature Liquid, L T l l Solid, S X0 A B Phase diagrams can be used to get quantitative information on the relative concentrations of phases using the Lever rule : i.e. ~25% solid and ~75% liquid at X0 At temperature, T and molar fraction X0, the solid and liquid phase will coexist in equilibrium according the ratio: nl = nl Where n/n is ratio of liquid to solid
Solid to liquid phase diagram in a two component system : A and B are completely miscible and ideal solutions
Binary phase diagrams : The Miscibility gap G G T2 T1 solid L a b c d S Common tangent liquid A B A B G liquid Single phase, mixed solid T3 T1 L T2 S 2 phase: (A+B) and (B+A) Compositions e and f ; “The miscibility gap” f e e f T3 A B A XB B HMIX > 0
Titanium-Vanadium revisited Blue : single phase (bcc) White : two phase (hcp) (bcc) • What can we deduce? • Ti and V atoms bond weakly • There are no ordered phases • (Ti,V) phase : mixture of Ti and V in a fcc structure • Ti (hcp) phase does not dissolve V well
Equilibrium in heterogenous systems For systems with phase separation ( and ) of two stable structures (e.g. fcc and bcc), we must draw free energy curves. G is the curve for A and B in fcc structure ( phase) G is the curve for A and B in bcc structure ( phase) For: X0<e phase only X0>e phase only Common tangent If e<X0>e then minimum free energy is Ge And two phases are present (ratio given by the Lever rule – see later) When two phases exist in equilibrium, the activities of the components must be equal in the two phases:
Binary (two component) systems :Ordered phases Ordered substitutional Previous model gross oversimplification : need to consider size difference between A and B (strain effects) and type/strength of chemical bonding between A and B. Systems with strong A-B bonds can form Ordered and/or intermediate phases Ordered phases occur for (close to) integer ratios. i.e. 1:1 or 3:1 mixtures. But entropy of mixing is very small so increasing temperature can disorder the phase. At some critical temperature, long range order will disappear. Ordered structures can also tolerate deviations from stoichiometry. This gives the broad regions on the phase diagram
The Copper-Gold system Random mixture (fcc) (fcc) Single phases Mixed phases N.B. Always read the legend!!! (blue is not always ‘singe phase’)
An intermediate phase is a mixture that has different structure to that of either component Range of stability depends on structure and type of bonding (Ionic, metallic, covalent…) Intermetallic phases are intermediate phase of integer stoichiometry e.g. Ni3Al Narrow stability range broad stability range
Binary phase diagrams : Ordered phases HMIX < 0 Peak in liquidus line : attraction between atoms i.e. A and B attract 1 phase, solid Weak attraction Strong attraction Ordered phase Ordered phase extends to liquid phase
Binary phase diagrams : Simple Eutectic systems Single phase Eutectic point HMIX 0 ; A and B have different crystal structures; Two phase Phase is A with B dissolved (crystal structure A) Phase is B with A dissolved (crystal structure B)
Example : http://www.soton.ac.uk/~pasr1/index.htm Eutectic systems and phase diagrams
Binary phase diagrams : Peritectics and incongruent melting • Sometimes ordered phases are not stable as a liquid. These compounds have peritectic phase diagrams and display incongruent melting. • Incongruent melting is when a compound melts and decomposes into its components and does not form a liquid phase. • These systems present a particular challenge to material scientists to make in a single phase. Techniques like hot pouring must be used.
L + Na(K) Solid solution Na(+K) Solid solution K(+Na) L + K(Na) L + KNa2 Peritectic line (3 phase equil.) K(Na) + KNa2 (hcp) KNa2 + Na(K) (bcc) (bcc)
Binary phase diagrams : Additional equations A. Equilibrium vacancy concentration So far we have assumed that every atomic site in the lattice is occupied. But this is not always so. Vacancies can exist in the lattice. Removing atoms: increase internal energy (broken bonds) and increases configuration entropy (randomness). Define an equilibrium concentration of vacancies XV (that gives a minimum free energy) GV=HV TSV Where HV is the increase in enthalpy per mole of vacancies added and SV is the change in thermal entropy on adding the vacancies (changes in vibrational frequencies etc.). XV is typically 10-4-10-3 at the melting point of the solid. B. Gibbs-Duhem relationship This relates the change in chemical potential that results from a change in alloy composition:
Binary phase diagrams : Ternary phase diagrams These are complicated. • 3 elements so triangles are at fixed temperature • Vertical sections as a function of T and P are often given. Blue – single phase White – two phase Yellow – three phase
6. Kinetics of phase transformations So far we have only discussed systems in equilibrium. But we have said nothing of rate of a phase transformation. This is the science of Kinetics. G is the driving force of the transformation. Ga is the activation free energy barrier. Atoms must obtain enough thermal energy to overcome this barrier. General equation for the rate of the transformation is the Arrhenius rate equation: i.e. high temperature implies faster rate N.B. some rates are very long e.g. diamond graphite