Download
1 / 29
290 likes | 424 Views
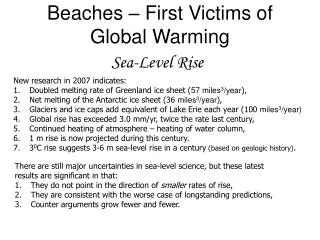
Sea Level Rise & Implication for Harbors and Marinas. Ronald M. Noble. Looking Into a Warmer Future…. Greenland (+21 ft) and Antarctica (+200 ft) melting will become largest contributor to global MSL rise. MSLR by 2100 Assuming Δ T < 4° C. (Nicholls, et al. 2011 Phil. Trans. Roy. Soc.).

E N D
Sea Level Rise & Implication for Harbors and Marinas Ronald M. Noble
Looking Into a Warmer Future… Greenland (+21 ft) and Antarctica (+200 ft) melting will become largest contributor to global MSL rise MSLR by 2100 Assuming ΔT < 4° C (Nicholls, et al. 2011 Phil. Trans. Roy. Soc.)
Global ≠ Regional MSLR 1992-2009 Global MSLR 3.3 mm/yr or 33 cm/cy Is MSL rise acceleration imminent on west coast? No Rise Fast Rise Global MSLR not evenly distributed dynamical effects! Reversal? “Regime Shift” http://www.aviso.oceanobs.com/ Bromirski, Miller, Flick, Auad, 2011. Dynamical suppression of sea level rise along the Pacific coast of North America: Indications for imminent acceleration, Jour. Geophys. Res. 116(C07005) Bromirski, Miller, Flick, 2012, North Pacific Sea Level Trends, Eos Trans. AGU, 93(27), 249-256.
Historical Mean Sea Level Trend: San Francisco Source: NOAA Website
Historical Mean Sea Level Trend: Los Angeles Source: NOAA Website
“Prediction is very difficult, especially if it's about the future.” - Niels ‘Yogi Berra’ Bohr
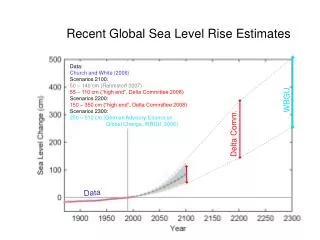
Global Sea Level Change Prediction (by 2100) Source: USACE EC 1165-2-212
USACE SLR Guidance: EC 1165-2-212 (2011) Three SLR scenarios: • “Low” SLR rate: using the historical rate of SLR • “Intermediate” SLR rate: using modified NRC Curve I • “High” SLR rate: using modified NRC Curve III
California Sea-Level Rise Guidance Document California Climate Action Team (CO-CAT) developed a SLR Guidance based upon NRC 2012 report SLR. CO-CAT includes state entities: • Business, Transportation and Housing Agency • Coastal Commission • Dept of Fish and Game • Dept of Parks and Recreation • Dept of Public Health • Dept of Toxic Substances Control • Dept of Transportation • Dept of Water Resources • Environmental Protection Agency • Governor’s Office of Planning and Research • Natural Resources Agency • Ocean Protection Council • Ocean Science Trust • San Francisco BCDC • State Coastal Conservancy • State Lands Commission • State Water Resources Control Board
California Sea-Level Rise Guidance Document CO-CAT reached agreement on the following policy recommendations for SLR
Wave-Driven Runup & Overtopping = Damage Stinson Beach, 1998 MSL is 20 feet lower! wave ^ Cardiff State Beach, 1998 Both private and public infrastructure is and will be at risk!
Waves, Storm Surge & High TidesFlooding & Erosion December 1982 Hs 3 m January 1983 Hs 4 m Mission Beach 2010
Extra 0.5-2 m! “Tuned” MSLR Beaches and infrastructure are “tuned” to current extremes of ~3m (10 ft) MSL (Bill O’Reilly cartoon)
Implication of SLR: Marina del Rey, California Over 1 in 6 chance sea level rise + storm surge + tide will overtop + 6 ft by 2100 Src: http://sealevel.climatecentral.org/
Implication of SLR: San Francisco, California Over 1 in 6 chance sea level rise + storm surge + tide will overtop +7 ft by 2100 Src: http://sealevel.climatecentral.org/
Return-Period ‘Creep’ Projections based on MSL rise “central” value +3 ft (2000-2100) NRC (2012) MSL is 20 feet lower! 100-yr Maximum Water Level (+5.2 ft MSL) in 2000 becomes 10-yr event in 2017, 1-yr event in 2048, and monthly in 2083
Waves, Storm Surge & High TidesFlooding & Erosion December 1982 Hs 3 m January 1983 Hs 4 m Mission Beach 2010
Wave-Driven Runup & Overtopping = Damage Stinson Beach, 1998 MSL is 20 feet lower! wave ^ Cardiff State Beach, 1998 Both private and public infrastructure is and will be at risk!
Mild -but- Variable Climate • Decades drought • Decades wet • Extremes 111⁰ - 26 Sep 1963 3.2” rain - 5 Apr 1926 25” rain 1940-41 26” rain 1883-84 • CA Four “Seasons” Quake Drought Fire Flood Dry? Wet Dry
Sea Level Rise Rates Vary El Niño -0.7 cm/cy 18 cm/cy -5.4 cm/cy Regional MSLR rates depend on large-scale atmospheric conditions over North Pacific Ocean