Download
1 / 11
110 likes | 233 Views
FEA Studies for the Shell A Thin Wall Region:. Run #1: Original run having E=193 GPa Run #2: Modify E of shell A by a thickness ratio of 1.18/1.5. The E of shell A become 152 GPa (Note: The model shell thickness is 1.375”)

E N D
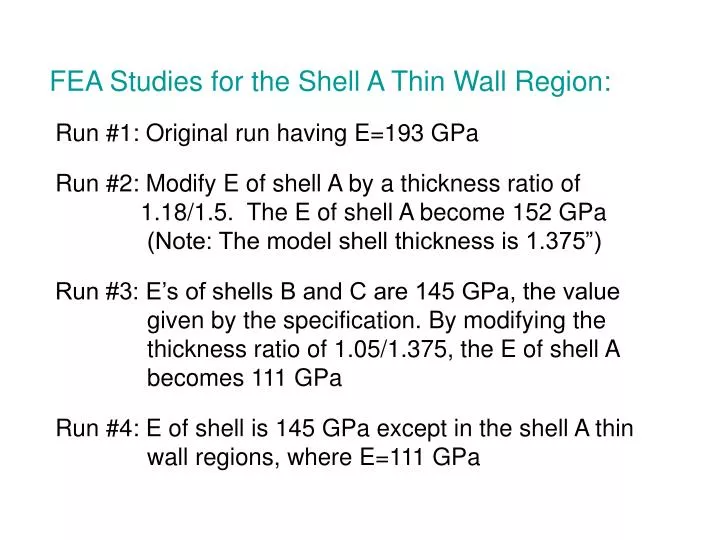
FEA Studies for the Shell A Thin Wall Region: Run #1: Original run having E=193 GPa Run #2: Modify E of shell A by a thickness ratio of 1.18/1.5. The E of shell A become 152 GPa (Note: The model shell thickness is 1.375”) Run #3: E’s of shells B and C are 145 GPa, the value given by the specification. By modifying the thickness ratio of 1.05/1.375, the E of shell A becomes 111 GPa Run #4: E of shell is 145 GPa except in the shell A thin wall regions, where E=111 GPa
Stresses in Shell Type A for Run No. 1 - E=193 GPa
Stresses in Shell Type A for Run No. 2 - E(A)=152 GPa, E(B&C)=193 GPa
Stresses in Shell Type A for Run No. 3 - E(A)=111 GPa, E(B&C)=145 GPa
Modulus of Elasticity in Shell Type A for Run No. 4 In the pink regions, E = 145 GPa In the brown regions, E=111 GPa Left View Right View
Stresses in Shell Type A for Run No. 4 - E=145 GPa, E(thin wall region)=111 GPa
Axial Stresses in Coil Type A for Run No. 1 - E=193 GPa Top View Side View
Axial Stresses in Coil Type A for Run No. 2 - E=(B&C)193 GPa, E(A)=152 GPa Top View Side View
Axial Stresses in Coil Type A for Run No. 3 - E=(B&C)145 GPa, E(A)=111 GPa Top View Side View
Axial Stresses in Coil Type A for Run No. 4 - E=145 GPa, E(thin wall region)=111 GPa Top View Side View
Shell Type A Coil Type A Max. Disp. Max. Seqv. Max. Disp. Max. Sz. (mm) (MPa) (mm) (MPa) Run #1 0.980 168 1.246 239 Run #2 1.184 164 1.451 244 Run #3 1.434 152 1.837 256 Run #4 1.168 161 1.517 248 Summary: