Download
1 / 42
430 likes | 463 Views
Learn to simulate shock and vibration response with Femap, Nastran, and Matlab in frequency and time domains. Utilize rigid links for accurate results. |

E N D
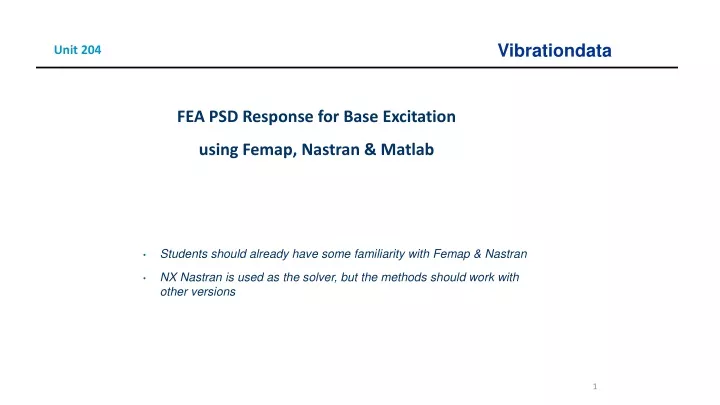
Unit 204 FEA PSD Response for Base Excitation using Femap, Nastran & Matlab Students should already have some familiarity with Femap & Nastran NX Nastran is used as the solver, but the methods should work with other versions
Introduction • Shock and vibration analysis can be performed either in the frequency or time domain • Continue with plate from Unit 200 • Aluminum, 12 x 12 x 0.25 inch • Translation constrained at corner nodes • Mount plate to heavy seismic mass via rigid links • Use “Random Response” analysis • PSD is “power spectral density” • Compare results with modal transient analysis from Unit 203 • The following software steps must be followed carefully, otherwise errors will result Rigid links
Procedure, part I • Femap, NX Nastran and the Vibrationdata Matlab GUI package are all used in this analysis • The GUI package can be downloaded from: https://vibrationdata.wordpress.com/ • The mode shapes are shown on the next several slides for review
Femap: Mode Shape 1 • The fundamental mode at 117.6 Hz has 93.3% of the total modal mass in the T3 axis • The acceleration response also depends on higher modes
Femap: Mode Shape 6 • The sixth mode at 723 Hz has 3.6% of the total modal mass in the T3 axis
Femap: Mode Shape 12 • The twelfth mode at 1502 Hz has 1.6% of the total modal mass in the T3 axis
Femap: Mode Shape 19 • The 19th mode at 2266 Hz has only 0.3% of the total modal mass in the T3 axis • But it still makes a significant contribution to the acceleration response
Matlab: Node 1201 Parameters for T3 • The Participation Factors & Eigenvectors are shown as absolute values • The Eigenvectors are mass-normalized • Modes 1, 6, 12 & 19 account for 98.9% of the total mass
Femap: Define Accel PSD Function • The X-axis unit is Frequency (Hz) • The Y-axis unit is Accel (G^2/Hz)
Femap: Constraints • Edit corner node constraints so that only TX & TY are fixed
Femap: Added Points and Node Node 2402 • Copy center point twice at -3 inch increments in the Z-axis • Place node on point at middle point
Femap: Configure Rigid Element, RBE2 • Dependent DOF is TZ • Dependent Nodes are the corner nodes • Node 2402 is the independent Node, -3 inch from plate’s center node in Z-axis
Femap: Plate with Rigid Element Rigid Link Node 2402
Femap: Load Set Step 1: Create Load Set Step 2: Dynamic Analysis
FEMAP: Constrain Base Mass Node • Note that the Z-axis is perpendicular to the plate
Femap: Node Check This step may be unnecessary but it is a “good engineering” practice
Femap: Node Group Node 1 Node 49 Node 2402 Node 1201 Node 2403
Femap: Element Group Element 50 Node 1201 Element 1129
Femap: Analysis Steps, PSD & Boundary Conditions PSD Function, previously defined
Femap: Analysis Final Step • Export the analysis model • Run in Nastran • Post-process the f06 file using the Matlab script as shown in the following slides
PSD Response at Plate Center Node This plot agrees with the result obtained in Unit 203
PSD Response at Plate Mid Edge Node This plot agrees with the result obtained in Unit 203


![PW0-204 Exam Dumps - Download PW0-204 Dumps PDF [2018]](https://cdn4.slideserve.com/7923284/cwnp-pw0-204-exam-certified-wireless-security-dt.jpg)