Download
1 / 58
580 likes | 681 Views
Business Statistics. Chapter 8 Estimating Population Values. Chapter Goals. After completing this chapter, learners should be able to: Distinguish between a point estimate and a confidence interval estimate

E N D
Business Statistics Chapter 8Estimating Population Values Tran Van Hoang - hoangtv@ftu.edu.vn - Business Statistics
Chapter Goals After completing this chapter, learners should be able to: • Distinguish between a point estimate and a confidence interval estimate • Construct and interpret a confidence interval estimate for a single population mean using both the z and t distributions • Determine the required sample size to estimate a single population mean within a specified margin of error • Form and interpret a confidence interval estimate for a single population proportion Tran Van Hoang - hoangtv@ftu.edu.vn - Business Statistics
Confidence Intervals Content of this chapter • Confidence Intervals for the Population Mean, μ • when Population Standard Deviation σ is Known • when Population Standard Deviation σ is Unknown • Determining the Required Sample Size • Confidence Intervals for the Population Proportion, p Tran Van Hoang - hoangtv@ftu.edu.vn - Business Statistics
Point and Interval Estimates • A point estimate is a single number, • a confidence interval provides additional information about variability Upper Confidence Limit Lower Confidence Limit Point Estimate Width of confidence interval Tran Van Hoang - hoangtv@ftu.edu.vn - Business Statistics
Point Estimates We can estimate a Population Parameter … with a SampleStatistic (a Point Estimate) μ x Mean p Proportion p Tran Van Hoang - hoangtv@ftu.edu.vn - Business Statistics
Confidence Intervals • How much uncertainty is associated with a point estimate of a population parameter? • An interval estimate provides more information about a population characteristic than does a point estimate • Such interval estimates are called confidence intervals Tran Van Hoang - hoangtv@ftu.edu.vn - Business Statistics
Confidence Interval Estimate • An interval gives a range of values: • Takes into consideration variation in sample statistics from sample to sample • Based on observation from 1 sample • Gives information about closeness to unknown population parameters • Stated in terms of level of confidence • Never 100% sure Tran Van Hoang - hoangtv@ftu.edu.vn - Business Statistics
I am 95% confident that μ is between 40 & 60. Estimation Process Random Sample Population Mean x = 50 (mean, μ, is unknown) Sample Tran Van Hoang - hoangtv@ftu.edu.vn - Business Statistics
General Formula • The general formula for all confidence intervals is: Point Estimate (Critical Value)(Standard Error) Tran Van Hoang - hoangtv@ftu.edu.vn - Business Statistics
Confidence Level • Confidence Level • Confidence in which the interval will contain the unknown population parameter • A percentage (less than 100%) Tran Van Hoang - hoangtv@ftu.edu.vn - Business Statistics
Confidence Level, (1-) (continued) • Suppose confidence level = 95% • Also written (1 - ) = .95 • A relative frequency interpretation: • In the long run, 95% of all the confidence intervals that can be constructed will contain the unknown true parameter • A specific interval either will contain or will not contain the true parameter • No probability involved in a specific interval Tran Van Hoang - hoangtv@ftu.edu.vn - Business Statistics
Confidence Intervals Confidence Intervals Population Mean Population Proportion σKnown σUnknown Tran Van Hoang - hoangtv@ftu.edu.vn - Business Statistics
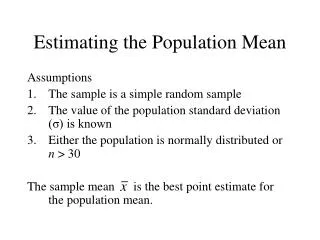
Confidence Interval for μ(σ Known) • Assumptions • Population standard deviation σis known • Population is normally distributed • If population is not normal, use large sample • Confidence interval estimate Tran Van Hoang - hoangtv@ftu.edu.vn - Business Statistics
Finding the Critical Value • Consider a 95% confidence interval: z.025= -1.96 z.025= 1.96 z units: 0 Lower Confidence Limit Upper Confidence Limit x units: Point Estimate Point Estimate Tran Van Hoang - hoangtv@ftu.edu.vn - Business Statistics
Common Levels of Confidence • Commonly used confidence levels are 90%, 95%, and 99% Confidence Coefficient, Confidence Level z value, 80% 90% 95% 98% 99% 99.8% 99.9% .80 .90 .95 .98 .99 .998 .999 1.28 1.645 1.96 2.33 2.58 3.08 3.27 Tran Van Hoang - hoangtv@ftu.edu.vn - Business Statistics
Interval and Level of Confidence Sampling Distribution of the Mean x Intervals extend from to x1 100(1-)%of intervals constructed contain μ; 100% do not. x2 Confidence Intervals Tran Van Hoang - hoangtv@ftu.edu.vn - Business Statistics
Margin of Error • Margin of Error (e): the amount added and subtracted to the point estimate to form the confidence interval Example: Margin of error for estimating μ, σ known: Tran Van Hoang - hoangtv@ftu.edu.vn - Business Statistics
Factors Affecting Margin of Error • Data variation, σ : e as σ • Sample size, n : e as n • Level of confidence, 1 - : e if 1 - Tran Van Hoang - hoangtv@ftu.edu.vn - Business Statistics
Example • A sample of 11 circuits from a large normal population has a mean resistance of 2.20 ohms. We know from past testing that the population standard deviation is .35 ohms. • Determine a 95% confidence interval for the true mean resistance of the population. Tran Van Hoang - hoangtv@ftu.edu.vn - Business Statistics
Example (continued) • A sample of 11 circuits from a large normal population has a mean resistance of 2.20 ohms. We know from past testing that the population standard deviation is .35 ohms. • Solution: Tran Van Hoang - hoangtv@ftu.edu.vn - Business Statistics
Interpretation • We are 95% confident that the true mean resistance is between 1.9932 and 2.4068 ohms • Although the true mean may or may not be in this interval, 95% of intervals formed in this manner will contain the true mean • An incorrect interpretation is that there is 95% probability that this interval contains the true population mean. (This interval either does or does not contain the true mean, there is no probability for a single interval) Tran Van Hoang - hoangtv@ftu.edu.vn - Business Statistics
Confidence Intervals Confidence Intervals Population Mean Population Proportion σKnown σUnknown Tran Van Hoang - hoangtv@ftu.edu.vn - Business Statistics
Confidence Interval for μ(σ Unknown) • If the population standard deviation σ is unknown, we can substitute the sample standard deviation, s • This introduces extra uncertainty, since s is variable from sample to sample • So we use the t distribution instead of the normal distribution Tran Van Hoang - hoangtv@ftu.edu.vn - Business Statistics
Confidence Interval for μ(σ Unknown) (continued) • Assumptions • Population standard deviation is unknown • Population is normally distributed • If population is not normal, use large sample • Use Student’s t Distribution • Confidence Interval Estimate Tran Van Hoang - hoangtv@ftu.edu.vn - Business Statistics
Student’s t Distribution • The t is a family of distributions • The t value depends on degrees of freedom (d.f.) • Number of observations that are free to vary after sample mean has been calculated d.f. = n - 1 Tran Van Hoang - hoangtv@ftu.edu.vn - Business Statistics
Degrees of Freedom (df) Idea: Number of observations that are free to vary after sample mean has been calculated Example:Suppose the mean of 3 numbers is 8.0 Let x1 = 7 Let x2 = 8 What is x3? If the mean of these three values is 8.0, then x3must be 9 (i.e., x3 is not free to vary) Here, n = 3, so degrees of freedom = n -1 = 3 – 1 = 2 (2 values can be any numbers, but the third is not free to vary for a given mean) Tran Van Hoang - hoangtv@ftu.edu.vn - Business Statistics
Student’s t Distribution Note: t z as n increases Standard Normal (t with df = ) t (df = 13) t-distributions are bell-shaped and symmetric, but have ‘fatter’ tails than the normal t (df = 5) t 0 Tran Van Hoang - hoangtv@ftu.edu.vn - Business Statistics
Student’s t Table Upper Tail Area Let: n = 3 df = n - 1 = 2= .10/2 =.05 df .25 .10 .05 1 1.000 3.078 6.314 0.817 1.886 2 2.920 /2 = .05 3 0.765 1.638 2.353 The body of the table contains t values, not probabilities 0 t 2.920 Tran Van Hoang - hoangtv@ftu.edu.vn - Business Statistics
t distribution values With comparison to the z value Confidence t t t z Level (10 d.f.)(20 d.f.)(30 d.f.) ____ .80 1.372 1.325 1.310 1.28 .90 1.812 1.725 1.697 1.64 .95 2.228 2.086 2.042 1.96 .99 3.169 2.845 2.750 2.58 Note: t z as n increases Tran Van Hoang - hoangtv@ftu.edu.vn - Business Statistics
Example A random sample of n = 25 has x = 50 and s = 8. Form a 95% confidence interval for μ • d.f. = n – 1 = 24, so The confidence interval is 46.698 …………….. 53.302 Tran Van Hoang - hoangtv@ftu.edu.vn - Business Statistics
Approximation for Large Samples • Since t approaches z as the sample size increases, an approximation is sometimes used when n 30: Correct formula Approximation for large n Tran Van Hoang - hoangtv@ftu.edu.vn - Business Statistics
Determining Sample Size • The required sample size can be found to reach a desired margin of error (e) and level of confidence (1 -) • Required sample size, σ known: Tran Van Hoang - hoangtv@ftu.edu.vn - Business Statistics
Required Sample Size Example If = 45, what sample size is needed to be 90% confident of being correct within ± 5? So the required sample size is n = 220 (Always round up) Tran Van Hoang - hoangtv@ftu.edu.vn - Business Statistics
Confidence Intervals for the Population Proportion, p • An interval estimate for the population proportion ( p ) can be calculated by adding an allowance for uncertainty to the sample proportion ( p ) Tran Van Hoang - hoangtv@ftu.edu.vn - Business Statistics
Confidence Intervals for the Population Proportion, p (continued) • Recall that the distribution of the sample proportion is approximately normal if the sample size is large, with standard deviation • We will estimate this with sample data: Tran Van Hoang - hoangtv@ftu.edu.vn - Business Statistics
Confidence interval endpoints • Upper and lower confidence limits for the population proportion are calculated with the formula • where • z is the standard normal value for the level of confidence desired • p is the sample proportion • n is the sample size Tran Van Hoang - hoangtv@ftu.edu.vn - Business Statistics
Example • A random sample of 100 people shows that 25 are left-handed. • Form a 95% confidence interval for the true proportion of left-handers Tran Van Hoang - hoangtv@ftu.edu.vn - Business Statistics
Example (continued) • A random sample of 100 people shows that 25 are left-handed. Form a 95% confidence interval for the true proportion of left-handers. 1. 2. 3. Tran Van Hoang - hoangtv@ftu.edu.vn - Business Statistics
Interpretation • We are 95% confident that the true percentage of left-handers in the population is between 16.51% and 33.49%. • Although this range may or may not contain the true proportion, 95% of intervals formed from samples of size 100 in this manner will contain the true proportion. Tran Van Hoang - hoangtv@ftu.edu.vn - Business Statistics
Changing the sample size • Increases in the sample size reduce the width of the confidence interval. Example: • If the sample size in the above example is doubled to 200, and if 50 are left-handed in the sample, then the interval is still centered at .25, but the width shrinks to .19 …… .31 Tran Van Hoang - hoangtv@ftu.edu.vn - Business Statistics
Finding the Required Sample Size for proportion problems Define the margin of error: Solve for n: p can be estimated with a pilot sample, if necessary (or conservatively use p = .50) Tran Van Hoang - hoangtv@ftu.edu.vn - Business Statistics
What sample size...? • How large a sample would be necessary to estimate the true proportion defective in a large population within 3%,with 95% confidence? (Assume a pilot sample yields p = .12) Tran Van Hoang - hoangtv@ftu.edu.vn - Business Statistics
What sample size...? (continued) Solution: For 95% confidence, use Z = 1.96 E = .03 p = .12, so use this to estimate p So use n = 451 Tran Van Hoang - hoangtv@ftu.edu.vn - Business Statistics
Using PHStat • PHStat can be used for confidence intervals for the mean or proportion • two options for the mean: known and unknownpopulation standard deviation • required sample size can also be found Tran Van Hoang - hoangtv@ftu.edu.vn - Business Statistics
PHStat Interval Options options Tran Van Hoang - hoangtv@ftu.edu.vn - Business Statistics
PHStat Sample Size Options Tran Van Hoang - hoangtv@ftu.edu.vn - Business Statistics
Using PHStat (for μ, σ unknown) A random sample of n = 25 has x = 50 and s = 8. Form a 95% confidence interval for μ Tran Van Hoang - hoangtv@ftu.edu.vn - Business Statistics
Using PHStat (sample size for proportion) How large a sample would be necessary to estimate the true proportion defective in a large population within 3%,with 95% confidence? (Assume a pilot sample yields p = .12) Tran Van Hoang - hoangtv@ftu.edu.vn - Business Statistics
Chapter Summary • Illustrated estimation process • Discussed point estimates • Introduced interval estimates • Discussed confidence interval estimation for the mean (σ known) • Addressed determining sample size • Discussed confidence interval estimation for the mean (σ unknown) • Discussed confidence interval estimation for the proportion Tran Van Hoang - hoangtv@ftu.edu.vn - Business Statistics
Exercises 7.3. Determine the 90% confidence interval estimate for the population mean • Mean = 102.36, n = 17, σ = 1.26 • Mean = 56.33, n = 21, s = 22.4 7.4. Determine the 95% confidence interval estimate for the population mean of a normal distribution • Mean = 13.56, n = 300, σ = 12.6 • Mean = 2.45, n = 31, s = 22.3 Tran Van Hoang - hoangtv@ftu.edu.vn - Business Statistics