Download
1 / 10
100 likes | 125 Views
Learn about different types of t-tests - 1-sample, 2-sample, matched pairs - and when to use them for statistical analysis. Explore examples and hypothesis testing procedures in detail.

E N D
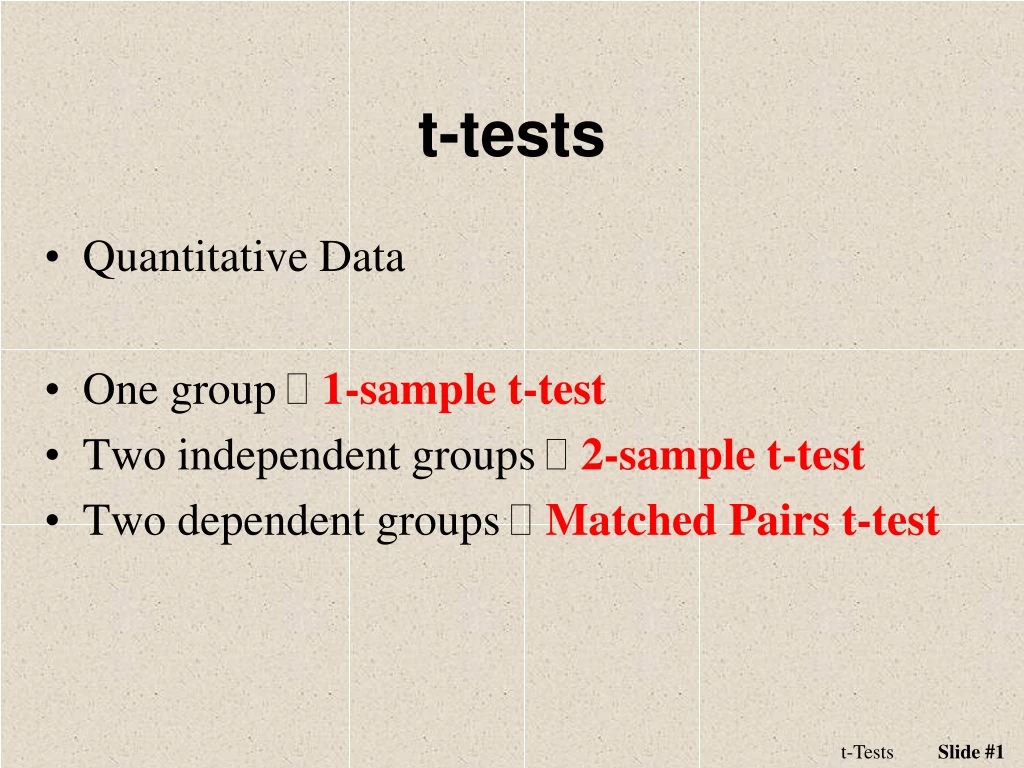
t-tests • Quantitative Data • One group 1-sample t-test • Two independent groups 2-sample t-test • Two dependent groups Matched Pairs t-test t-Tests
A Full Reality • No longer know what s is!!!!! • What should be used instead? • Our best guess at ss • Changes details, not the big picture t t-Tests
2-Sample t-test -- Examples • Do test scores differ between sections of a class? • Is the average number of yew per m2 different between areas exposed to and areas protected from moose browsing? • Does the time from ingesting a pill until a subject claims no more headache pain less for subjects given an experimental drug as compared to those given a placebo? t-Tests
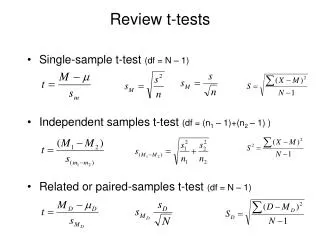
2-sample t-test because m1=m2 same as m1-m2=0 • Statistic: • Ho:m1 = m2 (where the subscript is a sample index) - 0 • Test Statistic: where sp2 is the pooled sample variance df = n1 + n2 - 2 t-Tests
2-sample t-test • Assume: • n1 + n2is large (to use a t-distribution) • n1 + n2>40, OR • n1 + n2> 15 and bothhistograms are not strongly skewed, OR • bothhistograms are approximately normal • the two samples are independent • s12 = s22 • Are s12 & s22 parameters or statistics? • Hypothesis Test -- Levene’s Test • Ho: s12 = s22 vs Ha: s12 s22 • What do you do with the p-value? t-Tests
Levene’s Test Summary • A hypothesis test within a hypothesis test. • Small p-values mean the variances are unequal. • If Levene’stest is a reject, can not continue with the 2-sample t-test (as presented here). t-Tests
2-sample t-test • When: quantitative data, samples from two populations, samples are independent t-Tests
A Full Example • A study of the effect of caffeine on muscle metabolism used 36 male volunteers who each underwent arm exercise tests. Eighteen of the men were randomly selected to take a capsule containing pure caffeine one hour before the test. The other men received a placebo capsule. During each exercise the subject's respiratory exchange ratio (RER) was measured. [RER is the ratio of CO2 produced to O2 consumed and is an indicator of whether energy is being obtained from carbohydrates or fats]. The question of interest to the experimenter was whether, on average and at the 5% level, caffeine changed mean RER. t-Tests
A Full Example Group n Mean StDevMin 1stQu Median 3rdQuMax Caffeine 18 94.22 4.870 84.0 93.00 94.00 96.75 105.0 Placebo 18 100.10 5.795 89.0 96.25 100.50 103.00 109.0 Levene’sTest p-value = 0.1993 t-Tests
R Handout t-Tests