Download
1 / 29
350 likes | 646 Views
Modern Geomorphology. In this lecture we consider hypothesis and test. Some slides drawn by Dr. Tracy Furutani. Rather heavy modifications to some of her slides are the responsibility of Prof. Smart. Some interesting links. First a review:. Scientific Method.

E N D
Modern Geomorphology In this lecture we consider hypothesis and test Some slides drawn by Dr. Tracy Furutani. Rather heavy modifications to some of her slides are the responsibility of Prof. Smart Some interesting links
First a review: Scientific Method • Science has a hypothetico-deductive framework • Scientific hypotheses have testable consequences • We test hypotheses to try to falsify them • Karl Popper 1934 Popper Logic of Scientific Discovery Mein Kopf ! Popper: Hypotheses In Science are Falsifiable http://www.eeng.dcu.ie/~tkpw/
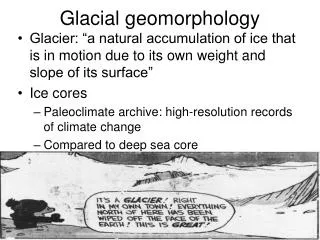
Basic Concepts • Catastrophism • Flood, Earthquake, Eruption, Tsunamis, Meteors • Uniformitarianism • Present is key to past, slower processes • Mountain building, Erosion, deposition, glaciers • James Hutton (1726-1797)
The Plate Tectonics Paradigm Uniformitarian and slow Modern Synthesis Braided Stream • Sudden Catastrophes • cause Mass Extinctions • Both are correct
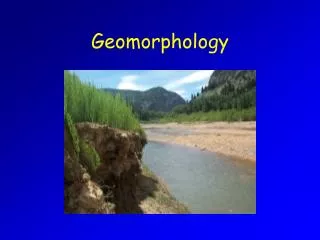
Geomorphology Geomorphology is the sub-discipline of geology that describes the physical changes of the surface of the earth over time
Now, down to business: Modern approaches to geomorphology • We use mathematical models and computer simulations to study real-world settings • Our ideas about the real world must have testable consequences. • Test them with real-world measurements, models, and/or experiments.
1. The shape of a bay • Bays along an active margin coast with a strong longshore current have a characteristic shape. • Given an erosion-resistant headland, this shape emerges every time. Dr. Tracy Furutani constructed initial slides for the three examples that follow.
The log spiral • The shape of a bay shore often conforms to the “log spiral” equation. • In polar coordinates, r = exp (-/4)
Physical reason - at first a puzzle Initially, there seemed no obvious reason the log-spiral equation should fit the shape of a shoreline so well
Physical reason • Later, derivations of coastline shape that required wave energy to dissipate evenly on the shore had the log - spiral curve as their solution. • Mystery solved, after we started with a simple assumption
We will consider this process later, when we study active coastlines
First Principles • This is very common in science. Wherever possible, we try to build mathematical models from assumptions we believe: The laws of thermodynamics, conservation of energy and momentum, are usually a good start. • We must always check that the assumptions of the version we use are true.
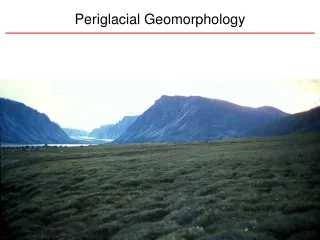
2. The speed and depth of a flood • The Purcell Ice Lobe dammed the Clark's Fork River about 15,000 years ago, forming Lake Missoula in Oregon and Washington. • When it melted, floods inundated the Columbia Plateau and Basin. The process of lobe advance, damming, and melt back repeated about 40 times, for about 2000 years. • The Channeled Scablands landform was the result. • How deep was the last flood?
The Draining of Glacial Lake Missoula Repeated many times, last time about 13000 ya
West Bar, along the Columbia River near Quincy, exhibits “mega-ripples” -- ripples generated by the massive flood Dramatic evidence remains
From the height and wavelength of the ripples, the depth and speed of the flood can be estimated. B is the wavelength between ripple crests B = 360 feet B
You can't see it well here , but there are 40 sets of ripples. H H = 24 feet
Curve Fitting From fluid dynamics, there are equations that relate the height (H) or wavelength (B) of a ripple to the depth (D) of the flood that generated it: These are curve fits from experiments; solve these for D, the depth
Let’s try it • If D = 1200 ft, H = 0.923 x 1200 0.455 • Then H = .923 x 25.18 = 23.24 ft • Also B = 37.8 x (1200) 0.348 • B = 37.8 x 11.79 = 445.7 ft • We can try this for different values of depth D and make a table, or we can solve for D in both equations
From these equations:If D = 1288 ft, H = 24 ft, If D = 650 ft, B = 360 ft. So the depth was somewhere in that range
For rectangular cross-sections with uniform depth d, the Froude number can be simplified to: The speed of the flood (v) is related through the depth (D): where Fr is the Froude number (varies from 0.5 and 0.9 for this situation) and g is the acceleration due to gravity Froude number
There are multiple possibilities, so let’s examine a few cases If Fr = 0.5 and D = 650 ft, v = 72 feet/sec If Fr = 0.9 and D = 1288 ft, v = 87 feet/sec Note the rectangular valley shape
Models • Scale models are used to study complex fluid systems where other approaches aren't usable http://vulcan.wr.usgs.gov/Projects/MassMovement/pictorial_summary_sept01.html
Buckingham π theorem • If we have process that is a function of n variables (force, work, volume, velocity, viscosity, density, etc. made of k fundamental units (mass, length, time, temp, etc.) then the original expression is equivalent to an equation involving a set of p = n − kdimensionless variables constructed from the original variables. We have already seen an example of a dimensionless number, the Froude number: For rectangular cross-sections with uniform depth d, the Froude Number can be simplified to There are many commonly used dimensionless numbers. More on this later
Similitude • Similitude is a concept used in the testing of models. Reality and the model must be: • the same shape. • fluid flow must have the same streamlines • ratios of all forces acting on reality and model are the same. Simulation of a meteor impact Tsunami with a partially submerged bursting balloon
We considered a huge rock on a slope. What if there are many smaller rocks? 3. Detrital hill slope failure • Over time, the slope of a pile of rocks degrades • The upper photo was taken in 1997. • The lower photo is of the same slope in 2007 ~55o ~30o and varies http://activetectonics.la.asu.edu/carrizo/application_full.html
Similitude • Gravel hit by fine mist from above models talus slope boulders hit by falling raindrops, IF the appropriate dimensionless numbers are comparable
A full scale experiment - during a flood, coarse detrital ripples form over a point bar. After the flood, waters recede and the ripples are exposed to the weather • Identical triangular ridges of wet fine gravel, hit by water drops from a hose nozzle, model the slumping of a gravel ripple exposed to the rain Courtesy Dr. Traci Furutani
Hypothesis Testing • We need a way of determining if the data from our experiment is predicted by our model, or is not different from sampling error. • Discussion: a fair coin • Null Hypothesis same # Heads & Tails • Later we will learn two simple methods of Statistical Hypothesis Testing. http://www.kean.edu/~csmart/Geomorphology/Lectures/Hypothesis Testing.ppt