Download
1 / 34
340 likes | 446 Views
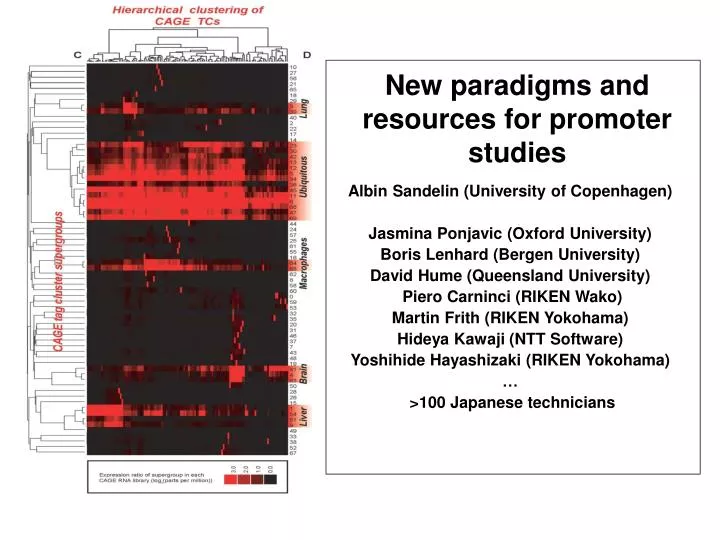
New paradigms and resources for promoter studies. Albin Sandelin (University of Copenhagen) Jasmina Ponjavic (Oxford University) Boris Lenhard (Bergen University) David Hume (Queensland University) Piero Carninci (RIKEN Wako) Martin Frith (RIKEN Yokohama) Hideya Kawaji (NTT Software)

E N D
New paradigms and resources for promoter studies Albin Sandelin (University of Copenhagen) Jasmina Ponjavic (Oxford University) Boris Lenhard (Bergen University) David Hume (Queensland University) Piero Carninci (RIKEN Wako) Martin Frith (RIKEN Yokohama) Hideya Kawaji (NTT Software) Yoshihide Hayashizaki (RIKEN Yokohama) … >100 Japanese technicians
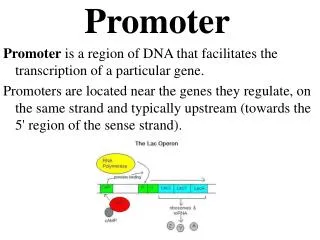
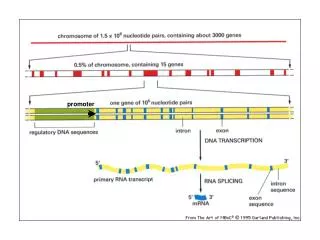
Aims • Introduction of Cap Analysis of Gene Expression (CAGE) data and resources • Insights on core promoter structure and transcriptional landscapes using CAGE • (The JASPAR database) Main references: Carninci et al Nat Genet. 2006 Jun;38(6):626-35 Carninci et al Science 2005 Sep 2;309(5740):1559-63 Katayama et al Science 2005 Sep 2;309(5740):1564-6. Frith et al Genome Res 2006 Jun;16(6):713-22. Ponjavic et al Genome Biol 2006 Aug 17;7(8):R78
What is CAGE? • CAGE tags are the 20 first nucleotides of a full-length cDNA • from a non-normalized cDNA library • Shiraki et al, PNAS 100:15776-81 (2003) Sequencing and mapping to the genome
Advantages • Large-scale sequencing with no cDNA normalization: • enables localization AND quantification of transcripts/promoters • Enables promoter localization with unprecedented sampling depth (sequence >1 million transcripts in one experiment…) • Base-pair resolution, with strand information • Quite impressive validation rates even for single tags (86% true positives by RACE) • Unbiased in terms of location: genome-wide • Different RNA populations can be sequenced and compared
Initial analysesSets: 7 million tags (mouse), 145 libraries5 million tags (human), 40 libraries
CAGE resources • Genomic element viewer ( very similar to UCSC browser) • CAGE tags and cDNA landscapes
CAGE resources • Basic CAGE viewer • Comprehensive browser of CAGE tags and CAGE tag clusters, and library information
CAGE resources • CAGE analysis viewer • Browse tissue specificity in core promoters
…if this is true, we would expect all CAGE tags in known promoters to cluster like this % of tags within a cluster (minimum 100 tags) -30 +30 +1
Mouse mRNA mRNA Human
Mouse Human
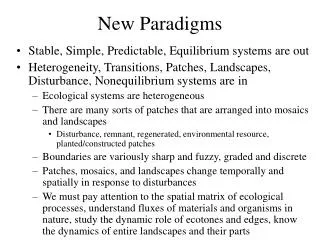
Take-home message I • At least two major types of TSS selection exists • This is correlated to both sequence content and tissue specificity • The majority of promoters are NOT the text-book type
What about the genome landscape? • Many more core promoters than previously seen (factor 5-10) – this is despite that many tissues are not sampled • What are they up to?
58% of genes have more than one promoter, many which are tissue-specific UDP-glucuronyl transferase gene: >= 7 promoters Take-home message: Do not talk about tissue-specific genes!
Promoters within 3’ UTRs The largest number of CAGE tags map to 5’ ends of genes However, there are many clear cases of significant start sites in 3’ UTRs!
Takehome message II • 1 gene – many promoters (what is a gene, anyway?) • Many uncharacterized promoters await deeper study • Many promoters and transcripts are at unexpected locations • The genome has become a messy place to work in – transcripts everywhere
Brief examples of more detailed analyses using the same dataset: Evolutionary turnover of TSS Frith et al 2006, Genome Res Dissection of TATA-containing core promoters Ponjavic et al 2006, Genome Biol (There are some 10 more)
TSS turnover (Frith et al) No turnover
TSS turnover (Frith et al) Total turnover
TSS turnover (Frith et al) Partial turnover
TSS turnover does exist • …although this is not the default situation (We find about 1000 cases) • When TSS turnover does occur, “phylogenetic footprinting” type TFBS search is problematic • Can all functional elements that are active on genome level undergo turnover?