Download
1 / 22
220 likes | 230 Views
Healthy Women: State Trends in Health and Mortality CD-ROM training. Kate Brett Joanna Skilogianis. Centers for Disease Control and Prevention National Center for Health Statistics. Purpose.

E N D
Healthy Women: State Trends in Health and Mortality CD-ROM training Kate Brett Joanna Skilogianis Centers for Disease Control and Prevention National Center for Health Statistics
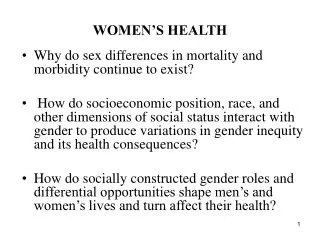
Purpose • This product is useful as a tool to look at mortality and health statistics among specific population groups within a state. • All data available concurrently by: • State, • Race and ethnicity, • Sex, and • Age
Development Considerations • All estimates are 3-year averages. • Pooling avoids confidentiality issues and gives the estimates greater precision. • Estimates with large standard errors are suppressed. • This product released as interactive data tables, not static paper publication. • User can format tables as desired. • Updates of the data can be released on the Internet easily.
Technical Issues • Precision: based on relative standard error (RSE) • RSE = SE/estimate • Mortality: suppression of estimates with less than 20 deaths (approximate RSE>23%). • BRFSS: suppression of estimates with RSE>30%. • Age-adjustment: All estimates are age-adjusted to the year 2000 standard population.
Data Sources • 1994-1998 Mortality • 1996-1999 Behavioral Risk Factor Surveillance System (BRFSS) • 2000 BRFSS updates now available on the website: • www.cdc.gov/nchs/healthywomen.htm
Beyond 20/20™ software • Software privately developed to allow interactive presentation of data. • The section of the software necessary to read the data is distributed with the data. • Information on how to use the software available: • on the CD-ROM insert, • in this presentation, and • on the web at: • www.cdc.gov/nchs/healthywomen.htm
Beyond 20/20 Concepts • Table: a presentation of multi-dimensional data and descriptive text. • Dimension: an attribute of the table’s data, e.g., sex, race, or State. • Item: an element of a dimension, e.g., Alaska is an item of the state dimension. • Tile: a rectangle in the table that shows the dimension name or the label of the item currently displayed.
Demonstration: Opening Tables • Open Beyond 20/20. • The Find Files box opens. • Choose type of data. • Choose subject matter. • If need help, look at table summary. • Highlight table, and press “OK”. • The Find File button can be used to go to this feature to find additional tables.
Summaries • Summaries contain information useful to understand the data being presented. • Any level of the table may have summary information. • If a summary is available, the label will be highlighted in blue.
Navigating Tables • Active dimension box: dimension that is “active”. • Note that the active dimension tile is highlighted. • Arrow keys allow one to move through the items in that dimension. • Highlighting different dimension tiles will change the active dimension.
Changing Table Views • Selecting data • Hiding and showing data using the item menu • Resetting view back to original using ‘view’ and ‘reset’ • Switching table dimensions • Nesting table dimensions
Charting • Create a chart using the chart button. • Change chart options using right mouse button. • Browse through a series of charts. • Select one of the headings in the title of the chart. • Use the arrow buttons to chart the previous or next item.
Mapping • Create a map using the map button. • Change map options using right mouse button. • Browse through a series of maps. • Select one of the headings in the title of the map. • Use the arrow buttons to chart the previous or next item.
Technical Support To receive technical support for using the Beyond 20/20 software, contact: Phyllis Chappell or Connie Banks PChappell@cdc.govCBanks@cdc.gov (919) 541-4466 (919) 541-3624 For information on the data itself, contact: Joanna Skilogianis or Kate Brett JSkilogianis@cdc.govKBrett@cdc.gov (301) 458-4735 (301) 458-4113
Mortality Example • Mortality by State, Race/Ethnicity, Sex, Age and Cause, 1994-1998 • Incidence of breast cancer mortality among various age groups of Hispanic white women in California and Florida in 1996-1998
BRFSS Example • Smoking Status by State, Race/Ethnicity, Sex and Age, 1996-1999 • Smoking status among white women aged 18-44 in 1997-1999