Download
1 / 29
290 likes | 310 Views
Explore the impact of sensor-based N management on wheat yields in the Yaqui Valley, Mexico. Analyze factors affecting NUE, runoff losses, and absorption curves. Compare farmer's management with sensor recommendations and potential gains. Study conducted by CIMMYT, Oklahoma State University, and Stanford University.

E N D
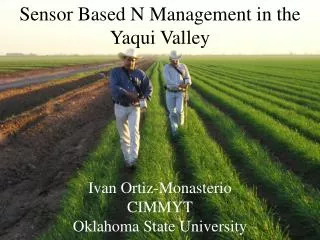
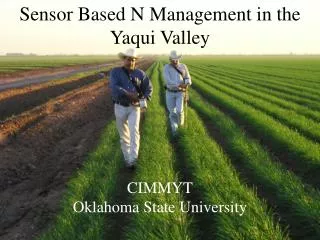
Sensor-based, site-specific N management in irrigated spring wheat in the Yaqui Valley, Mexico CIMMYT Oklahoma State University Stanford University
Losses due to runoff • Measurements in the Valley drains. • NO3 0 – 12 mg/L average 6 mg/L • NH4 0 - 12 mg/L average 6 mg/L • Harrison, 2003
$$$ Beman, 2005
Main Factors Associated with NUE • Timing • Rate
Cumulative nitrogen absorption curve in wheat 250 kgN/ha Farmer’s management 25% 0% 75% Fertilization
Cumulative nitrogen absorption curve in wheat Best alternative 67% 33% 0% Fertilization
Prob rain in January > X mm, 1969-2004 0.9 0.8 0.7 0.6 0.5 Prob > X 0.4 0.3 0.2 0.1 0 0 20 40 60 80 100 120 140 160 rain (mm)
1982-2002 Lobell, et al. 2002
RESULTS 2005-2006
N rich Strip 5 -20 ha Farmer’s Management Sensor Management
Cumulative nitrogen absorption curve in wheat 250 kgN/ha Farmer’s management 25% 0% 75% Fertilization
Potential Gains 250 Average N rate from farmer’s surveys 250 - 127 = 123 x 9 pesos = 1107 pesos/ha
272 N 0 N 270 x 9 pesos = 2430 pesos/ha 243,000 pesos/100 has
11 tons Chicken Manure Conventional Management + 150 units of N Sensor recommended ZERO His neighbor applied + 75 kg N on top of the 11 tons of CM. He did not apply any more N Yield was the same 150 x 9 = 1,350 Cesar Valenzuela