Download
1 / 28
280 likes | 449 Views
Agassiz National Wildlife Refuge Water Quality Investigation. James Graham, U.S. Fish and Wildlife Service. Thief Lake. Thief River Falls. Grand Forks. Thief River Watershed = TRW 1,077 sq. mi. Agassiz National Wildlife Refuge (USFWS) 26 different impoundments – 26, 321 acres

E N D
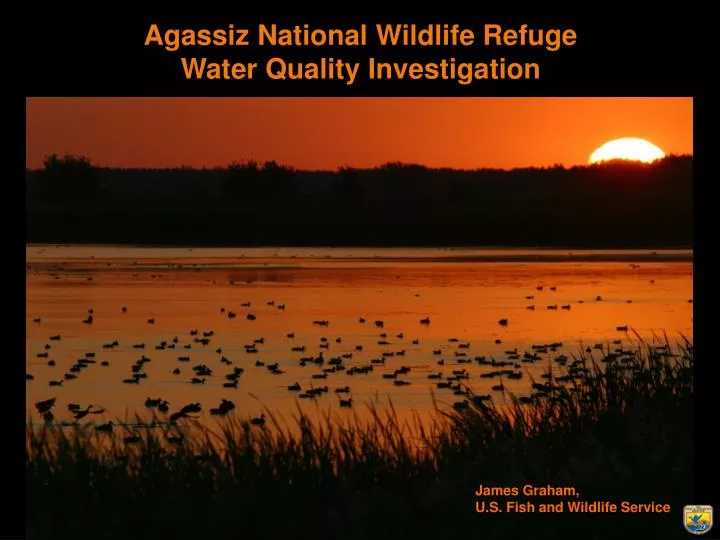
Agassiz National Wildlife Refuge Water Quality Investigation James Graham, U.S. Fish and Wildlife Service
Thief Lake Thief River Falls Grand Forks Thief River Watershed = TRW 1,077 sq. mi
Agassiz National Wildlife Refuge (USFWS) 26 different impoundments –26, 321 acres Thief Lake Wildlife Management Area (MN DNR) Thief Lake – 7,100 acres 11 small impoundments on west end of Thief Lake – 210 acres *Moose River Impoundment (North Pool) – 1,250 acres *Moose River Impoundment (South Pool) – 2,250 acres Subtotal = 10,810 Thief River Falls Wildlife Area Office (MN DNR) Eckvoll – 1,750 acres Lost River Pool – 2,300 acres Farmes Pool (state-owned portion) – 245 acres Subtotal = 4,295 Total Wildlife Impoundment Surface Acres in TRW = 41,426 *shared mgmt. w/ Red Lake Watershed District
Agassiz NWR Comprehensive Conservation Plan (2005) Objective 2.7: Managing Water Impoundments - Manage water impoundments as a complex of basins to provide wetland diversity and improve water quality for maximum benefits to migrating and breeding birds. Management will be within the capabilities of the wetland system as a whole…
Present Conditions • Thief River upstream of Agassiz NWR drains ~ 350 mi2 north and east of the Refuge. • Mud River drains ~ 160 mi2 east of the Refuge. • Both of the above waterways enter and exit the Refuge in a channelized form. • Primary local land use is agriculture, including row-crop farming and small grains. • Drainage facilitated by more than 1,200 mi of county and judicial ditches in the TRW. • Sedimentation and nutrient loading (e.g., nitrogen, phosphorus) are primary water quality concerns in the TRW.
Agassiz National Wildlife Refuge Water Quality Project Rochelle Nustad, USGS, Grand Forks, ND Data Collection: 2008 - 2010 Results coming. Analysis in progress. Final report – summer(?) 2011
Contracted the St. Croix Watershed Research Station (Science Museum of MN) to help answer the above questions. - Drs. Dan Engstrom and Shawn Schottler Questions to Answer Where is the sediment coming from ? What is the amount and rate of infilling ? Is Agassiz Pool a net source of sediment ? 4. What is the effect of Main Ditch 11 ?
137Cs 210Pb decay Sediment Dating & Fingerprinting Radioisotopes: 210Pb ,137Cs 210Pb: Natural, constant “fallout” - Dating tool back 150 years - Fingerprint of field erosion 137Cs:Bomb testing product, - Marker for 1963 - Fingerprint of field erosion
Coring Sites Sediment Cores: An Archive of Erosion History Thief River Inlet Agassiz Pool Main Ditch 11 October 2008
Things we know from the radioisotopes and composition…. ~ 65% of the sediment is inorganic (was not produced in lake) • Agassiz Pool is accumulating • sediment • Agassiz Pool is a trap of • incoming sediment • (likely a net producer of organic • matter; e.g., algae) Agassiz Pool Ditch 11 • Main portion of pool is accumulating slower than pool-wide average Pb inventory can be used to estimate total sediment.
Total Sediment Accumulated 1938 – 2008 (Agassiz Pool) Agassiz Pool 23,000 tons/yr 1,600,000 tons >1,040,000 tons from off-Refuge inputs Agassiz Pool Lake Pepin ~700,000 tons/yr Ditch 11
Effect of Main Ditch 11(within Agassiz Pool) Agassiz Pool Ditch 11 Ditch ~49ft. x 9.5ft. x 19,030ft. Sediment density = 1g/cm3 - Main Ditch 11 is now essentially full within the Pool Holds 260,000 tons of sediment If spread over entire Pool = 3.2 cm deep
3.2 cm may not seem like a lot, but… - As little as 0.25 cm of sediment can significantly reduce total abundance and species richness of plants that emerge from seed banks. - sediment deposition can enhance the growth of certain plant species (i.e., narrowleaf and hybrid cattail) - Less than 0.5 cm of sediment can render aquatic invertebrate egg banks ineffective. Effect of Main Ditch 11(within Agassiz Pool) Agassiz Pool Ditch 11 Ditch ~49ft. x 9.5ft. x 19,030ft. Sediment density = 1g/cm3 If spread over entire Pool = 3.2 cm deep
3.2 cm may not seem like a lot, but… - As little as 0.25 cm of sediment can significantly reduce total abundance and species richness of plants that emerge from seed banks. - sediment deposition can enhance the growth of certain plant species (i.e., narrowleaf and hybrid cattail) - Less than 0.5 cm of sediment can render aquatic invertebrate egg banks ineffective. Effect of Main Ditch 11(within Agassiz Pool) Agassiz Pool Ditch 11 Ditch ~49ft. x 9.5ft. x 19,030ft. Sediment density = 1g/cm3
2006: 1948: Pool elev. = 1140.2’ Pool elev. = 1140.5’ Non-Uniform Filling Based on 210Pb Inventory from the cores: - Main Pool is filling 1/3 as fast as whole Pool average • Emergent vegetation is expanding • Sediment infilling - assist vegetation expansion
Lake margins, inlet bays, and shallow areas = ~3000 acres 700,000 tons Ditch 11 260,000 tons Main Pool ~7000 acres 660,000 tons Sediment Loading 1938 - 2008 Webster Pool Ditch 11 If whole basin estimate calculated earlier is correct
Main Judicial Ditch 11 – looking east across Agassiz Pool • Constructed in 1910 to a mean depth of 9.5 ft., top width of 59 ft. and bottom width of 40 ft. • 2010 – nearly completely filled with sediment the entire length of 3.7 mi (within the Pool)
7.77’ deep - roughly ¼ mi E. of radial gates
0.59’ deep - roughly ½ mi. E. of radial gates
0.13’ deep 2.63 mi E. of radial gates
0.38 pCi/g Fingerprinting Sediment Sources with 137Cs (based on studies in Minnesota River Basin) Constant Exposure to Rain Fingerprint Cultivated Field Ratio: Field to Non-field Suspended Sediment ~0.0 pCi/g Non-field Erosion Minimal Exposure to Rain
Surface sediment from core 0.33 0.52 0.39 0.47 0.68 Agassiz Pool and Incoming River 137Cs Fingerprint Ditch/river input, suspended sample (2009) (avg. of two samples May-June) Values = 137Cs concentration pCi/g Avg (Fingerprint) = 0.47 pCi/g 0.27 0.50 0.35 0.6 0.46 0.70
Field Fingerprint ~0.28 - 0.48 pCi/g Agassiz Fingerprint = 0.47 pCi/g What do fingerprints tell us about source of sediment? • Reminder: • >1,040,000 tons of sediment in lake from external sources • ~15,000 tons/yr fromexternal sources • Reference fingerprint of Northwestern MN may be different • Variable results, difficult to be precise • Most importantly • Agassiz is shallow and filling with agricultural inputs
Summary • Agassiz Pool is filling in • >65% of sediment comes from river/ditch inputs (external) • Ditch 11 is full and holds ~15% of current sediment burden • Margins and inlet areas have “filled” • …. rate of infilling in open water areas may now accelerate • Erosion of ag. fields / uplandsis dominate sediment source • These processes facilitate expansion of unwanted vegetation • (e.g., narrow-leaved cattail)
Agassiz Pool Sediment Budget*based on Soil and Water Assessment Tool (SWAT Model) outputs Thief River Watershed Assessment Project - RLWD - more coming in than going out - greatest amount of sediment entering from Thief River (versus Mud R.) - estimated that 57% of sediments that enter Agassiz Pool are deposited there. (a past sediment investigation in the Thief River Watershed estimated ~ 67% of incoming sediment Is deposited)