Download

1 / 20
200 likes | 321 Views
Managerial Economics & Business Strategy. Chapter 1 The Fundamentals of Managerial Economics. Key Functions we will be using. Five key functions Demand Linear Total Revenue Quadratic Production Cubic Total cost Cubic Profit Cubic. $. Demand. P=a-bQ (or Q = a-bP). Q. $.

E N D
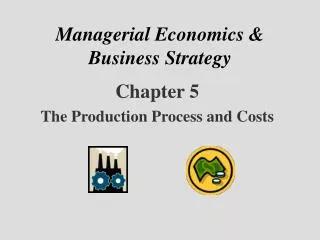
Managerial Economics & Business Strategy Chapter 1 The Fundamentals of Managerial Economics
Key Functions we will be using • Five key functions • Demand • Linear • Total Revenue • Quadratic • Production • Cubic • Total cost • Cubic • Profit • Cubic
$ Demand P=a-bQ (or Q = a-bP) Q
$ Total Revenue TR=a+bQ-cQ2 a=0 Q
Production (short run) $ TP=a+bL+cL2-dL3 a=0 Q
$ Cost (short run) TC=a+bQ-cQ2+dQ3 Q
$ Profit • = a-bQ+cQ2-dQ3 a<0 Q
Why is this important? • The more data that can be obtained • The more mathematics can be used • The more precise we can be • The closer we can get to maximized profits
Managerial Economics & Business Strategy Chapter 2 Market Forces: Demand and Supply
Shows the amount of a good that will be purchased at alternative prices, holding other factors constant. Law of Demand As price increases (decreases) QUANTITY demanded decreases (increases) Negative Slope Quantity Market Demand Curve Price D
Do we remember the difference?? • Change in Quantity Demanded • Movement along the demand curve do to change in PRICE • Change in Demand • Shift of the demand curve do to other non-price determinates
Price A to B: Increase in quantity demanded 10 6 4 7 Quantity Change in Quantity Demanded A B D0
Change in Demand Price 6 D1 D0 Quantity 7 13 D0 to D1: Increase in Demand
Determinants of Demand • Income • Normal good • Inferior good • Prices of Related Goods • Prices of substitutes • Prices of complements • Advertising and consumer tastes • Population • Consumer expectations
Quick Example… • Milk market: The price of cereal increases • Milk market: The price of milk decreases • Milk market: People become lactose intolerant • Milk market: The price of soy milk increases • Milk market: An outbreak of mad cow disease has killed 2/3 of the nation’s cow supply. Consumers now fear that prices for milk will increase over the next several months.
SELF TEST-Do we understand?? • Substitutes • Coke vs. Pepsi --- what happens if the price of Coke increases? • Qd of Pepsi? • NOTHING • Qd of Coke? • DECREASES • Demand for Coke? • NOTHING • Demand for Pepsi? • INCREASES
Compliments • Tennis Balls and Tennis Rackets --- what happens if the price of Tennis Rackets increase? • Qd of Tennis Balls? • NOTHING • Qd of Tennis Rackets? • DECREASES • Demand for Tennis Balls? • DECREASES • Demand for Tennis Rackets? • NOTHING
The Demand Function • The functional form representing the demand curve Qxd = f(Px ,PY , M, H,) • Qxd = quantity demand of good X. • Px = price of good X. • PY = price of a related good Y. • Substitute good. • Complement good. • M = income. • Normal good. • Inferior good. • H = any other variable affecting demand.
Linear Demand Curve • What do we know?? • Px price of good x • Law of demand holds • Py price of good y • The goods are substitutes • M income • Good is inferior • A advertising • Advertising helps sell the good
Inverse Demand Function • Linear demand curve is Qx = f (P….) • BUT…when we graph it we use • Price as a function of quantity demanded. • Example: • Demand Function • Qxd = 10 – 2Px • Inverse Demand Function: • 2Px = 10 – Qxd • Px = 5 – 0.5Qxd