Download
1 / 7
70 likes | 159 Views
Analyze the probability of coin tosses, test answers, and school lunch scenarios using binomial distributions. Learn how to construct histograms and visualize the data. Practice calculating probabilities in different scenarios.

E N D
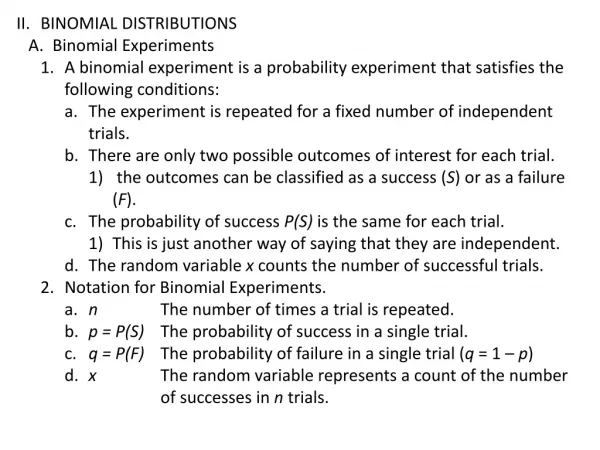
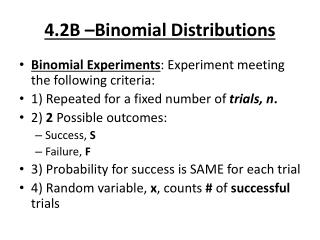
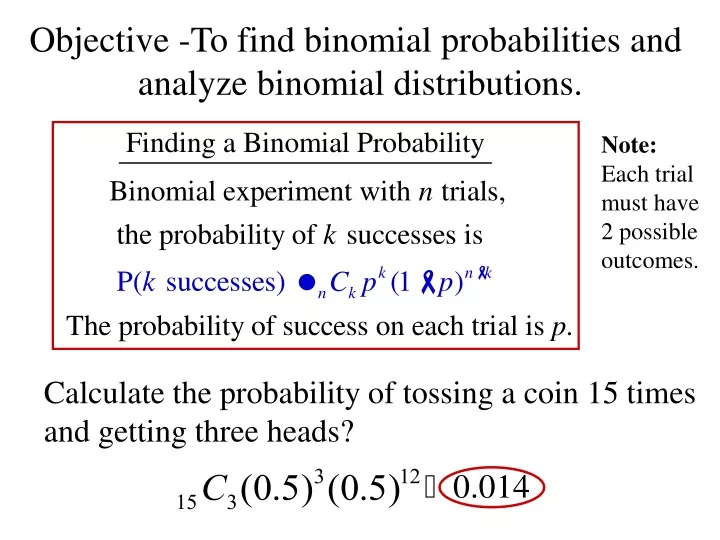
Objective -To find binomial probabilities and analyze binomial distributions. Note: Each trial must have 2 possible outcomes. Calculate the probability of tossing a coin 15 times and getting three heads?
Calculate the probability of randomly guessing all the correct answers on a 25 question multiple choice test which has 5 choices for each problem ? Calculate the probability of randomly guessing 20 correct answers on a 25 question multiple choice test which has 5 choices for each problem ?
Constructing a Binomial Distribution In a class of students the probability of a child eating the school lunch is 0.28. Draw a histogram of the binomial distribution based on the probability that exactly k students in a class of 8 students eat the school lunch.
Constructing a Binomial Distribution In a class of students the probability of a child eating the school lunch is 0.28. Draw a histogram of the binomial distribution based on the probability that exactly k students in a class of 8 students eat the school lunch.
Histogram of the Binomial Distribution Skewed Distribution- not symmetric.