Download
1 / 33
330 likes | 593 Views
Solid Waste Disposal and Recycling in Wisconsin. Brad Wolbert Cynthia Moore Wisconsin DNR August 24, 2010. Solid Waste in Wisconsin: The Basics. WI Solid Waste Disposal Trends. Decreasing Waste Imports. Decreasing Waste Imports. What Exactly Goes to Landfills?.

E N D
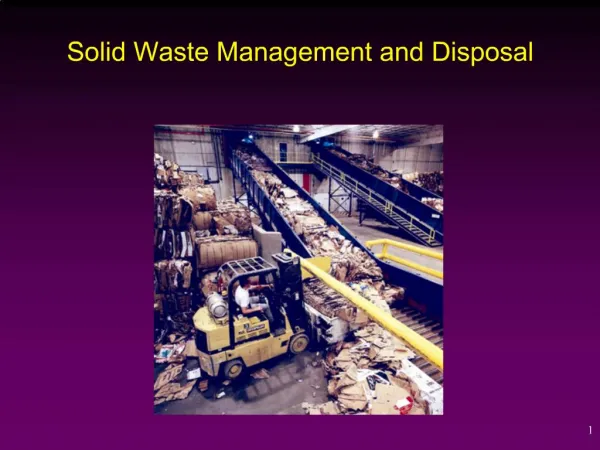
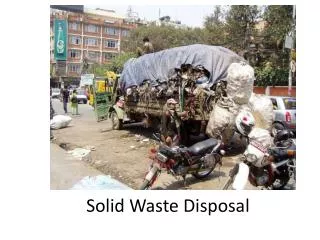
Solid Waste Disposal and Recycling in Wisconsin Brad Wolbert Cynthia Moore Wisconsin DNR August 24, 2010
What Exactly Goes to Landfills? Statewide waste composition studies performed in 2002 and 2009 have given us detailed snapshots of what Wisconsin residents are throwing away....
Greenhouse Gas Implications • Recycling all readily recyclable materials would have saved 3.1 million metric tons of CO2 equivalent, or emissions from: • 592,000 passenger cars • 16,178 railcars of coal, or ~ one power plant • Annual electricity use of 375,971 households • Recycling the plastics alone would have saved 141,000 MTCO2e
PET Bottles • #1 resin code • Highly recyclable for bottle-to-bottle, carpet, clothing, strapping, other products • If substituted for virgin material, 24,000 tons would save the energy equivalent of: • 14.4 million gallons of gasoline (0.6% of annual WI consumption) • Annual fuel needs of 24,000 cars* _________ * Assumes car is driven 12,000 miles/year at 20 mpg
HDPE Bottles • #2 resin code • Highly recyclable for lumber, pipe, containers, film, pallets and crates • If substituted for virgin material, 15,500 tons would save the energy equivalent of: • 8.0 million gallons of gasoline (0.3% of annual WI consumption) • Annual fuel needs of 13,385 cars* __________ * Assumes car is driven 12,000 miles/year at 20 mpg
Rigid Plastic Packaging • Variety of polymer types: PET (#1), HDPE (#2), PP (#5) • Recyclable, but difficult to sort without optical sorting equipment • End use not compatible with PET and HDPE bottles • If substituted for virgin material, 54,500 tons would save the energy equivalent of: • 26.2 million gallons of gasoline (1.1% of annual WI consumption) • Annual fuel needs of 43,600 cars* _________ * Assumes car is driven 12,000 miles/year at 20 mpg
Plastic Film • Mostly LDPE or LLDPE (#4 resin code) • Some HDPE (#2 resin code) or PVC (#3) • Except for PVC, highly recyclable if clean • If substituted for virgin material, 238,000 tons would save the energy equivalent of: • 111.5 million gallons of gasoline (4.5% of annual WI consumption) • Annual fuel needs of 210,000 cars* ___________ * Assumes car is driven 12,000 miles/year at 20 mpg
Some Caveats • Weights are “wet” weights • Weights include residual contamination that sorters could not immediately clean off • Composite/other plastic includes weight of other (composited) material, e.g., metal portion of plastic toy • Impact may be disproportional to weight • In landfill • In environment
Sources Waste composition studies: http://dnr.wi.gov/org/aw/wm/recycle/studies/index.html EPA WARM model (GHG calculator): http://www.epa.gov/climatechange/wycd/waste/calculators/Warm_home.html Energy conversions: http://www.p2pays.org/ref/06/05476.pdf
Overview ofWisconsin’s Recycling Program • State Recycling law (1990) prohibits landfill disposal and incineration • Tires, appliances, yard waste, waste oil, lead acid batteries • Newspaper, cardboard, magazines, office paper, food/beverage containers • New bans: electronics (9/2010), oil filters & absorbents (1/2011)
Local Government Recycling Programs • Responsibility Units for Recycling (RUs) • Every community must have one! • Individual or multi jurisdictional – 1060 RUs in state • Local recycling ordinance requiring • Ban on disposal of banned materials • Recycling of banned materials by households and at non-residential facilities and locations • Education and outreach component • Submit annual report with collection tonnages • Enforcement authority
Character of RU Recycling Programs High degree of variability in services provided • State law sets minimum requirements. Preponderance of small individual RU programs • 80% of RUs account for 20% of population and 20% of total tonnage of recyclables collected
Recycling Data Sources -RUs • RU Annual Reports • Required of all 1060 RUs • Tons “banned” paper & containers collected from 1-4 residential unit dwellings (should include private service collection) • Banned plastics: plastics 1 & 2 ; 3-7 exempted • Does not include • Materials not “Banned” (i.e. residential mixed paper) • Multi-family or non-residential (commercial, “away from home”) • 2008 change in data reporting impacts trend analysis
RU Recycling Data: Plateau RU data points to plateau in collection despite high incidence of recycling “convenience” factors • At least 70% curbside service • At least 35% single stream service
Recycling Data Sources: MRFs • MRF Annual Reports • Required of all 82 MRFs serving a RU (including 7 out of state facilities) • As of 2008, report tonnages processed of paper & containers from all sources (residential and other) • Does not include materials sent directly to paper mills, scrap recyclers, other processors Photo courtesy Faherty Inc.
MRF WI Plastic Tons Processed 2008 • Processed “output” depends on market factors (availability, prices, quality of material received) • China is main market • “Mixed” PET • Blow mold vs injection • Limited markets for 3-7 • Confusion over labeling
Gaps in Recycling Data • Limited mandatory statewide reporting • RUs- Residential collection of banned materials (total tons) • MRFs – Banned materials by commodity type; includes some commercial • Challenges to coupling RU and MRF data • No state requirement for reporting on: • commercial, industrial, agricultural, “away from home”, direct delivery to scrap metal or paper recyclers or dealers, etc. • No reliable data source: film, rigid containers, bars & restaurants, packaging • Challenges to data collection (cost, QA, response rate) • No data on waste generation, source reduction
Estimating Recycling Rates Rate = ____2008 MRF WI Tonnage_______ 2009 LF Tonnage + 2008 MRF WI Tonnage • Different years • Large out-of-state MRFs don’t segregate WI data • MRF categories don’t match LF categories • LF weights include more contamination
Cardboard – 69% Newspaper – 94% Office paper – 41% Magazines – 91% PET – 57% HDPE – 81% #3-7 – 85% Steel cans – 89% Glass – 77% Aluminum – 73% Direct measurement of trash and recycling from same households Small sample size (~40) Single family dwellings only Same contamination issues as for trash weights Does not account for litter, cash redemptions of aluminum Fitchburg 2009 Capture Rate Study
Contacts Brad Wolbert – 608-264-6286 Brad.Wolbert@wisconsin.gov Cynthia Moore – 608-267-7550 Cynthia.Moore@wisconsin.gov