Download
1 / 25
250 likes | 398 Views
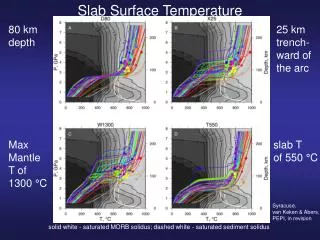
Global Tomography -150 km depth. Continental cratons - cold, rigid material Spreading centers & mountains - warm mantle. P , S, and Q Tomography - Tonga Arc. Velocity tomography shows anomalies relative to average model [ Conder and Wiens , 2005];

E N D
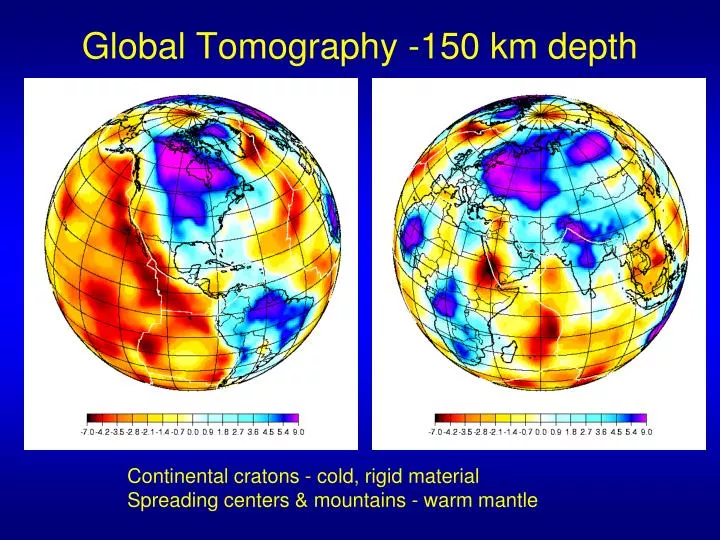
Global Tomography -150 km depth Continental cratons - cold, rigid material Spreading centers & mountains - warm mantle
P,S, and Q Tomography - Tonga Arc Velocity tomography shows anomalies relative to average model [Conder and Wiens, 2005]; Q tomography shows log(Q) from new tomographic Inversion of data from Roth et al [1999]
How are geophysical observations related to material properties? Geophysical observables: P velocity S velocity Attenuation (1/Q) Velocity Anisotropy Electrical Conductivity Material Properties: Temperature Melt content Composition Water (+ other volatiles?) ? Complex and Difficult Inverse Problem !
Density Shear Velocity What about composition? Fe-Mg ratio in mantle xenoliths More iron gives higher density & lower velocity But is there a competing trend in Al ?
Temperature effect on seismic velocity and attenuation -- no melt • P and S velocities are controlled by anharmonic temperature derivatives at temperatures below about 900 C --- relatively linear VP/T ~ 0.8 %; VS/T ~ 1 % per 100C • Above 900 C is more non-linear due to attenuation effect (Faul et al., 2005) • Attenuation shows an exponential dependence on temperature Q-1 (T) exp (-E* / RT) and is also dependent on grain size and frequency (Jackson et al., 2002) • Since V/T and Q-1/T have somewhat different relationships, combining velocity and attenuation promises to provide strong constraints on temperature structure • Should determine P, S, and Q structure to provide maximum constraints on material properties
How do material properties affect mantle seismic observables? • Temperature effect on seismic velocity -- no melt present • Experimental results: • P and S velocities are controlled by anharmonic temperature derivatives at temperatures below about 900 C --- relatively linear VP/T ~ 0.6 m/s/K ( 0.8 % per 100C); VS/T ~ 0.45 m/s/K (1 % per 100C) • Above 900 C the relationship is non-linear due to attenuation effect • Is also a function of frequency, grain size, and depth (Jackson et al., 2002; Faul and Jackson, 2005) Shear Velocity Velocity derivative
Studies linking seismic velocities and temperature often use a single value of dV/dT • However, dV/dT has strong temperature and depth dependence due to anelastic contribution • Temperature derivative drops by a factor of two between 50 and 350 km depth • = dlnVs/dlnVp = (Vs/Vs)/ (Vp/Vp) values greater than 1.6 are often said to indicate melt • However, temperature variations allow large values without melt Temperature and depth dependence of dV/dT Depth variation of dVs/dT dlnVs/dlnVp vs Temperature
Melt - Possible attenuation mechanisms grain boundary sliding can be - elastically accommodated: unique equilibrium state -> attenuation peak - diffusionally accommodated: continuous -> no peak
Melt Geometry • The effect of melt on seismic velocity is a function of the melt geometry • There is still a controversy about melt geometry and how it varies with percent melt • Melt geometry is also related to porosity and permeability and how fast melt escapes q < 60 q > 60 Node q q Tubule Wark et al.,2003
Melt Geometry from Experiments From Faul et al., [1994]
Shear Velocity Reduction and Attenuation for Olivine containing Melt Modulus Reduction and Attenuation Mechanism Melt and seismic attenuation • Line thickness gives melt content; • line color gives grain size • For a given grainsize, 1% melt gives nearly an order • of magnitude increase at 1 Hz • Seismic velocity reduction occurs through • both “melt squirt” and grain boundary sliding Faul et al., 2004
Effect of Water? Karato, 2003 810 ppm H/Si = .005 wt % water - normal MORB Mariana backarc - .01 to 0.25 wt % H2O in the mantle source
Qualitative description of the effect of parameters on seismic observables Wiens and Smith, 2003
P,S, and Q Tomography - Tonga Arc Velocity tomography shows anomalies relative to average model [Conder and Wiens, 2005]; Q tomography shows log(Q) from new tomographic Inversion of data from Roth et al [1999]
Effect of mantle convection pattern on melt localization This model includes a backarc spreading center Melting region in backarc is asymmetric due to mantle flow driven by the subducting slab Magma production in the arc is much reduced due to depletion of the incoming Mantle Note that contours show melt production - but no constraints on in-situ melt content Potential Temperature Conder et al., 2002
Temperature Model Geodynamic Modeling of Tomographic Velocities S velocity calculated from temperature model P velocity calculated from temperature model
Modeling Attenuation Structure Calculated Q model (temperature effect only) Temperature model Q tomography


![Global scale [> 20000 km] Synoptic scale [2000–20000 km] Mesoscale [2-2000 km] Microscale](https://cdn1.slideserve.com/3357411/slide1-dt.jpg)