Download
1 / 41
410 likes | 525 Views
GIS Brownbag Series. Attributes. In the beginning…. Earliest GIS systems did not have attributes Needed separate layers for labels (e.g. names). CAD software still maintains different separate layers. Amelia Earhart.

E N D
GIS Brownbag Series Attributes
In the beginning… Earliest GIS systems did not have attributes Needed separate layers for labels (e.g. names) CAD software still maintains different separate layers
Right-click on the name of the shapefile for the flight path to open attribute table Shapefile showing Amelia’s last flight
Attributes: • Length • FROM_CITY • TO_CITY
Feeding sites of a chimp called “Fifi” Aerial photograph of Gombe National Park. Feeding sites stored in a shapefile or personal geodatabase Aerial photograph stored as a raster
Raster attributes Number of attributes attached to rasters is limited
Shapefile or Personal Geodatabase Attributes OBJECTID and Shape attributes are automatically generated by ArcGIS Many attributes can be attached to each feature
Attributes can be: • Numbers (whole or with decimal places) • Names or text • Dates • Hyperlinks
Depending on type of attribute different maps can be created This map was created based on text attribute Numbers allow to display population size
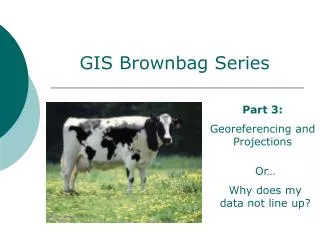
Depending on type of attribute different analysis can be done What if you want to show the area for each County?
Adding fields to an attribute table Step 1: Create a new attribute that will hold the area A. Open attribute table B. Click “Options” button. Then select “Add Field” If “Add Field..” is “greyed-out” stop edit session and try again
Pick any name you like. Must be < 11 characters Other choices: Text, Date, Short or Long Integer Number of spaces to store a number Number of decimals. E.g. 1.1234
Step 2: Calculate the area The new attribute “Area” has been added! Right-click on “AREA” and select Calculate Geometry Notice how all the area’s are set to “0”
Joining other data to attribute tables Table with population size for each County Goal: show those numbers on a map Solution: join this data to the shapefile from previous slide Step 1: Save your data in Excel as a DBF4 file
Determine how you are going to join your data Join “population” table to shapefile Look for a primary key: an attribute that both tables have in common and that can be used for the join. Here: both tables have County names
Joining tables Right-click on the shapefile
Make sure that primary key is the same data type in both tables: E.g. you can not join numbers to text. Choose “No”
Data from “population” table we joined to the shapefile Data from shapefile
Map showing population size for each County Maybe population density would be a more informative map..
Types of Relationships This is a one-to-one relationship One record in the shapefile matches one record in the population table
? Types of Relationships Is this a one-to-one relationship? NO! It is a one-to-many Can we join this data? NO! Instead of “join”, use a “relate”
Relates: Example DBF table with information about a few different laterals Goal: we want to look at those laterals on a map
This is a one-to-many relationship Relate NHD to the laterals table This is the NHD: it has the geometry
By clicking the + you see related tables Use “info” tool on this line segment Attributes for that line segment
By relating tables the user has much more information at “his/her fingertips” Tables that NHDFlowline layer is related to
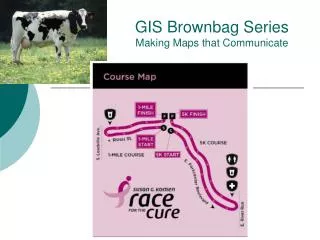
Upcoming Brownbag Lectures May 20: Model Builder June 17: How to make maps that communicate Check out previous Brownbag Presentations on WEnet