Download
1 / 11
110 likes | 243 Views
Crime statistics, crime trends, et al March 24 th 2012, Llandudno. www.ukcrimestats.com. Why do we need independent crime data analysis?. To increase public confidence in data To find errors To have a benchmark of accountability To release new thinking and innovation.

E N D
Crime statistics, crime trends, et alMarch 24th 2012, Llandudno www.ukcrimestats.com
Why do we need independent crime data analysis? • To increase public confidence in data • To find errors • To have a benchmark of accountability • To release new thinking and innovation
Why and how crime statistics are used • First measure a problem to allocate the resource • How collected? Recorded crime, insurance claims, surveys • How used? To distribute Police resources more efficiently, for insurers to guage risk, for Politicians to make a fuss !
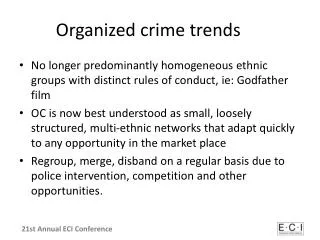
The 3 subsets of crime data • About the Suspect/Criminal • About the Victim • About the Crime
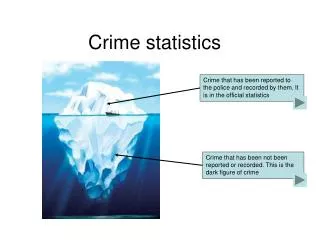
Limitations of Crime Statisics 1: • Recorded v. Believed v. unknown Actual • Crime usually requires secrecy
Limitations of Crime Statisics 2: People • Static & transient population • Key to Crime Rate • Population growing and always moving
North Wales compared to Other Forces: Big PictureDec10 to Jan 12 (Crime Rate) • ASB – 26/43 • Burglary – 32/43 • OC – 27/43 • Robbery – 36/43 • Vehicle – 39/43 • Violent - 9/43 • Total – 28/43
283 Neighbourhoods • Highest – all Crime + ASB Rhyl West(Denbighshire Coastal and Abergele) • Highest – Violent Rhyl West(Denbighshire Coastal and Abergele) • Highest – Burglary Rhyl West(Denbighshire Coastal and Abergele) • Highest – Drug Offa(Wrexham Town)
Thankyou Please visit www.ukcrimestats.com and feel free to make any comments, suggestions.