Download
1 / 53
570 likes | 837 Views
Soils & Hydrology II. Soil Water Precipitation and Evaporation Infiltration, Streamflow, and Groundwater Hydrologic Statistics and Hydraulics Erosion and Sedimentation Soils for Environmental Quality and Waste Disposal Issues in Water Quality.

E N D
Soils & Hydrology II • Soil Water • Precipitation and Evaporation • Infiltration, Streamflow, and Groundwater • Hydrologic Statistics and Hydraulics • Erosion and Sedimentation • Soils for Environmental Quality and Waste Disposal • Issues in Water Quality
What is the significance of understanding streamflow? • Why are we concerned with how it relates to Landscapes? • Streamflow is important because it is related to: • Construction of houses, bridges, spillways, and culverts • Surface Runoff over landscapes, including flooding • The associated processes of Erosion, Transport, and Deposition. • Drinking and Irrigation water supplies, especially during droughts • Recreational activities, such as boating and fishing • Navigation of commercial shipping and transport
Hydrograph: • Plots precipitation and runoff over time. • Runoff can be discharge, flow, or stage
Measurement Units • 1 cfs • 2 AF/day • 450 gpm • 28.3 Lps • 1 m3/s = 35.28 cfs • 1 mgd 1.5 cfs • 1 gpm = 3.785 Lpm cfs: cubic feet per second gpm: gallons per minute mgd: million gallons per day AF/day: Acre-Feet per day cumec: cubic meters per second Lps: liters per second Lpm: liters per minute
Weir Types • where • Q is flow, cfs • c are weir coefficients • h is stage, ft • r is the pipe diameter, ft • W is the weir width, ft Circular opening: Q = c r2 h1/2 Rectangular: Q = c W h3/2 Triangular: Q = c h5/2
Coweeta Hydrologic Station Rectangular Weir V-Notch (Triangular) Weir
Field Velocity Measurements Flow Equation: Q = v A where Q is the discharge, cfs v is the water velocity, ft/s A is the flow cross-sectional area, ft2
Manning's Equation • When flow velocity measurements are not available • v = (1.49/n) R2/3 S1/2 • where • v is the water velocity, ft/s • n is the Manning's hydraulic roughness factor • R = A / P is the hydraulic radius, ft • A is the channel cross-sectional area, ft2 • P is the channel wetted perimeter, ft • S is the water energy slope, ft/ft
Hydrologic Statistics: • Trying to understand and predict streamflow • Peak Streamflow Prediction: • Our effort to predict catastrophic floods • Recurrence Intervals: • Used to assign probability to floods • 100-yr flood: • A flood with a 1 chance in 100 years, or a flood with a probability of 1% in a year.
Return Period • Tr = 1 / P • Tr is the average recurrence interval, years • P is exceedence probability, 1/years • Recurrence Interval Formulas: • Tr = (N+1) / m • Gringarten Formula: Tr = (N+1-2a) / (m-a) • where • N is number of years of record, • a = 0.44 is a statistical coefficient • m is rank of flow (m=1 is biggest)
River Stage: • The elevation of the water surface • Flood Stage • The elevation when the river overtops the natural channel banks.
Rating Curve • The relationship between river stage and discharge
Peak Flows in Ungaged Streams • Qn = a Ax Pn • where • A is the drainage area, and • Pn is the n-year precipitation depth • Qn is the n-year flood flow • Q2 = 182 A0.622 • Q10 = 411 A0.613 • Q25 = 552 A0.610 • Q100 = 794 A0.605
Curve Number Method • Most common method used in the U.S. for predicting stormflow peaks, volumes, and hydrographs. • Useful for designing ditches, culverts, detention ponds, and water quality treatment facilities.
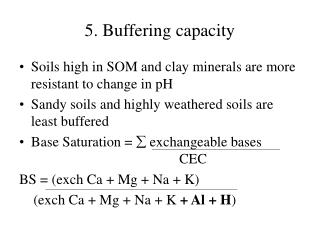
P = Precipitation, usually rainfall • Heavy precipitation causes more runoff than light precipitation • S = Storage Capacity • Soils with high storage produce less runoff than soils with little storage. • F = Current Storage • Dry soils produce less runoff than wet soils
r = Runoff Ratio => how much of the rain runs off? • r = Q / P • r = 0 means that little runs off • r = 1 means that everything runs off • r = Q / P = F / S • r = 0 means that the bucket is empty • r = 1 means that the bucket is full • F = P - Q or r = Q / P = (P - Q) / S • the soil fills up as it rains • Solving for Q yields: • Q = P2 / (P + S)
S is maximum available soil moisture • S = (1000 / CN) - 10 • CN = 100 means S = 0 inches • CN = 50 means S = 10 inches • F is actual soil moisture content • F / S = 1 means that F = S, the soil is full • F / S = 0 means that F = 0, the soil is empty • Land Use CN S, inches • Wooded areas 25 - 83 2 - 30 • Cropland 62 - 71 4 - 14 • Landscaped areas 72 - 92 0.8 - 4 • Roads 92 - 98 0.2 - 0.8
Curve Number Procedure • First we subtract the initial abstraction, Ia, from the observed precipitation, P • Adjusted Rainfall: Pa = P - Ia • No runoff is produced until rainfall exceeds the initial abstraction. • Ia accounts for interception and the water needed to wet the organic layer and the soil surface. • The initial abstraction is usually taken to be equal to 20% of the maximum soil moisture storage, S, => Ia = S / 5 • The runoff depth, Q, is calculated from the adjusted rainfall, Pa , and the maximum soil moisture storage, S, using: • Q = Pa2 / (Pa + S) • or use the graph and the curve number • We get the maximum soil moisture storage, S, from the Curve Number, CN: • S = 1000 / CN - 10 • CN = 1000 / (S + 10) • We get the Curve Number from a Table.
Example • A typical curve number for forest lands is CN = 70, so the maximum soil storage is: S = 1000 / 70 - 10 = 4.29" • A typical curve number for a landscaped lawn is 86, and so • S = 1000 / 86 - 10 = 1.63” • A curve number for a paved road is 98, so S = 0.20” • Why isn’t the storage equal to zero for a paved surface? • The roughness, cracks, and puddles on a paved surface allow for a small amount of storage. • The Curve Number method predicts that Ia = S / 5 = 0.04 inches of rain must fall before a paved surface produces runoff. • For a CN = 66, how much rain must fall before any runoff occurs? • Determine the maximum potential storage, S = 1000 / 66 - 10 = 5.15" • Determine the initial abstraction, Ia = S / 5 = 5.15” / 5 = 1.03" • It must rain 1.03 inches before runoff begins. • If it rains 3 inches, what is the total runoff volume? • Determine the effective rainfall, Pa = P - Ia = 3" - 1.03" = 1.97" • Determine the total runoff volume, Q = 1.972 / (1.97 + 5.15) = 0.545"
Unit Hydrograph Example • A unit hydrograph has been developed for a watershed • The peak flow rate is 67 L/s for 1 mm of runoff and an area of 100 ha • What is the peak flow rate for this same watershed if a storm produces 3 mm of runoff? • The unit hydrograph method assumes that the hydrograph can be scaled linearly by the amount of runoff and by the basin area. • In this case, the watershed area does not change, but the amount of runoff is three times greater than the unit runoff. • Therefore, the peak flow rate for this storm is three times greater than it is for the unit runoff hydrograph, or 3 x 67 L/s = 201 L/s. • What would be the peak flow rate for a nearby 50-ha watershed for a 5-mm storm? • Peak Flow: Qp = Qo (A / Ao ) (R / Ro ) where • Qp is the peak flow rate and Qo is for a reference watershed, • A is the area of watershed and Ap is the area of reference watershed. • Q = (67 L/s) (50 ha / 100 ha) (5 mm / 1 mm) = 168 L/s • In this case, the peak runoff rate was scaled by both the watershed area and the runoff amount.
Streamflow and Land Management • BMPs improve soil and water quality • Most of our attention is placed on preventing pollution, decreasing stormwater, and improving low flows. • Forestry • Forest streams have less stormflow and total flow, but more baseflow • Forest litter (O-Horizon) increases infiltration • Forest canopies intercept more precipitation (higher Leaf-Area Indices, LAI) • Forest have higher evapotranspiration rates • Forest soils dry faster, have higher total storage
Forest Management • Harvesting • High-lead yarding on steep slopes reduces soil compaction • Soft tires reduces soil compaction • Water is filtered using vegetated stream buffers (SMZs) • Water temperatures also affected by buffers • Roads • Road runoff can be dispersed onto planar and convex slopes • Broad-based dips can prevent road erosion • Site Preparation • Burning a site increases soil erosion and reduces infiltration • Leaving mulch on soils increases infiltration • Piling mulch concentrates nutrients into local "hot spots" • Distributing mulch returns nutrients to soils • Some herbicides cause nitrate increase in streams
Forestry Compliance in Georgia with Water Quality Protection Standards (1991-2004)
Agricultural Land Management • Overland flow is a main concern in agriculture • increases soil erosion, nutrients, and fecal coliform • increases herbicides, pesticides, rodenticides, fungicides • Plowing • exposes the soil surface to rainfall (and wind) forces • mulching + no-till reduces runoff and increases infiltration • terracing and contour plowing also helps • Pastures (livestock grazing) • increases soil compaction • reduces vegetative plant cover • increases bank erosion • rotate cattle between pastures and fence streams • Urban Land Management • Urban lands have more impervious surfaces • More runoff, less infiltration, recharge, and baseflow • Very high peak discharges, pollutant loads • Less soil storage, channels are straightened and piped, no floodplains • Baseflows are generally lower, except for irrigation water (lawns & septic)